Bạn đã bao giờ tưởng tượng có thể biến những suy nghĩ phức tạp, những…
New Google Chat usage reports provide deeper insights into user engagement
What’s changing
From introducing spaces, meetings, voice messaging, and more, Google Chat has added important new features and transformed significantly over the years. As a result, Google Chat usage reporting has evolved. Starting today, we’re excited to introduce new, rich usage reports to help Workspace admins understand how their teams use Google Chat.
The charts being added are:
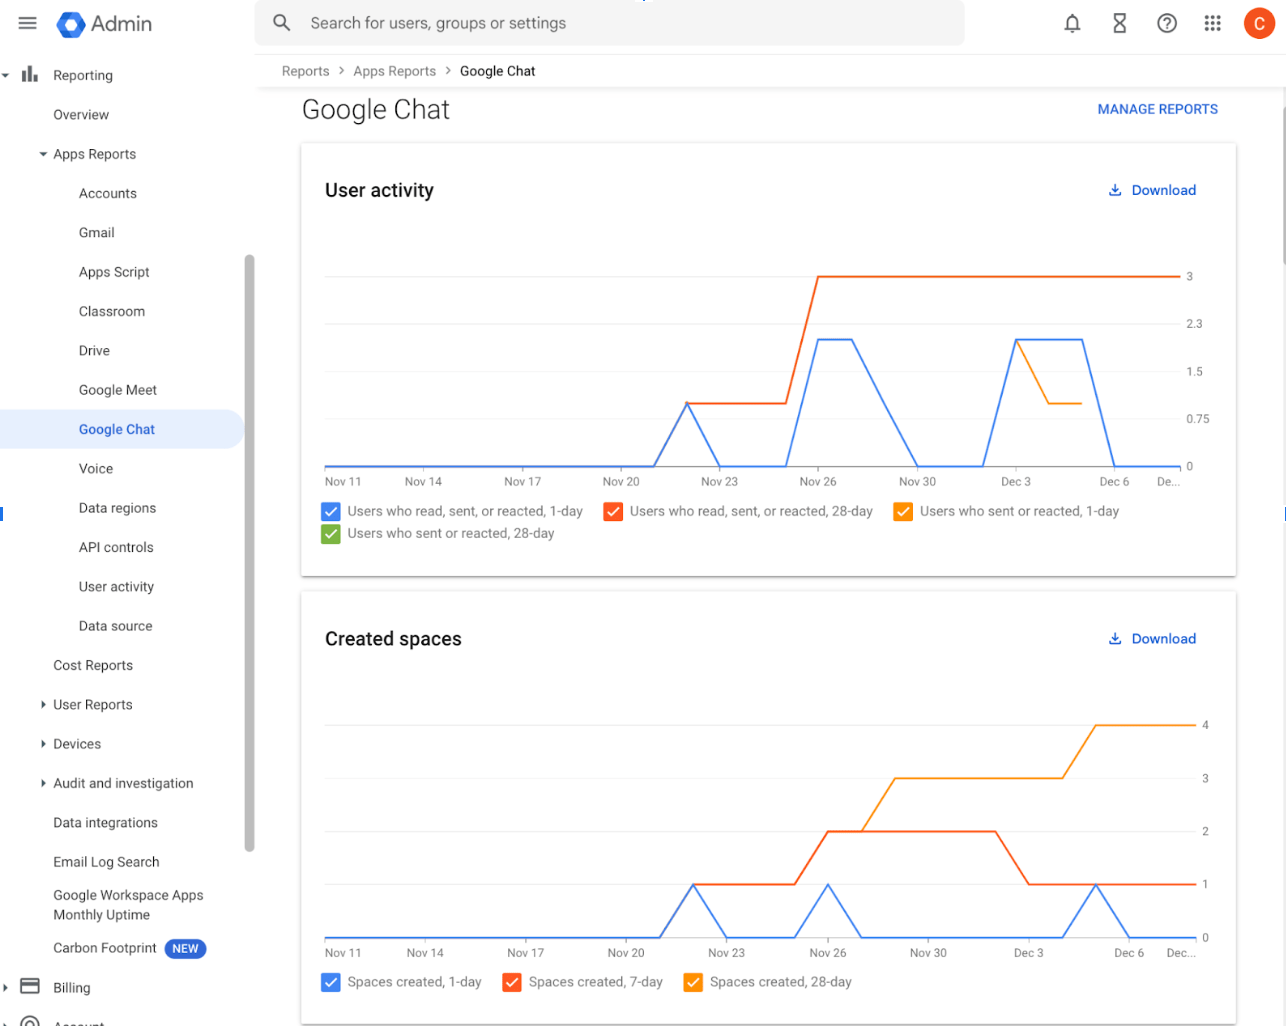
- User activity: the number of users based on two types (engaged and communicating) in the last 1 day and 28 days over a period of the last 180 days.
- “Engaged” users: these users read conversations. These users may, but are not required to, send messages and react to messages.
- “Communicating” users: these users send or react to messages. The number of communicating users is a subset of engaged users.
- Messages sent: the number of messages sent by users of your organization in 1 day, 7 day, and 28 day period over a period of the last 180 days.
- Messages sent by conversation type: the number of messages sent in 1 day in direct messages, group and space conversations over a period of the last 180 days.
- Messages sent by type: the number of messages sent in 1 day broken out by message type: regular message, voice or video, huddle over a period of the last 180 days.
- Messages sent with attachment: the number of messages sent with or without attachments in 1 day over a period of the last 180 days.
- Messages sent to conversations with external participants: the number of messages sent to conversation that include or may include users external to your organization over a period of the last 180 days.
- Created spaces*: the number of spaces created by users of your organization in 1 day over a period of the last 180 days
- Active spaces*: the number of spaces owned by your organization in 1 day over a period of the last 180 days.
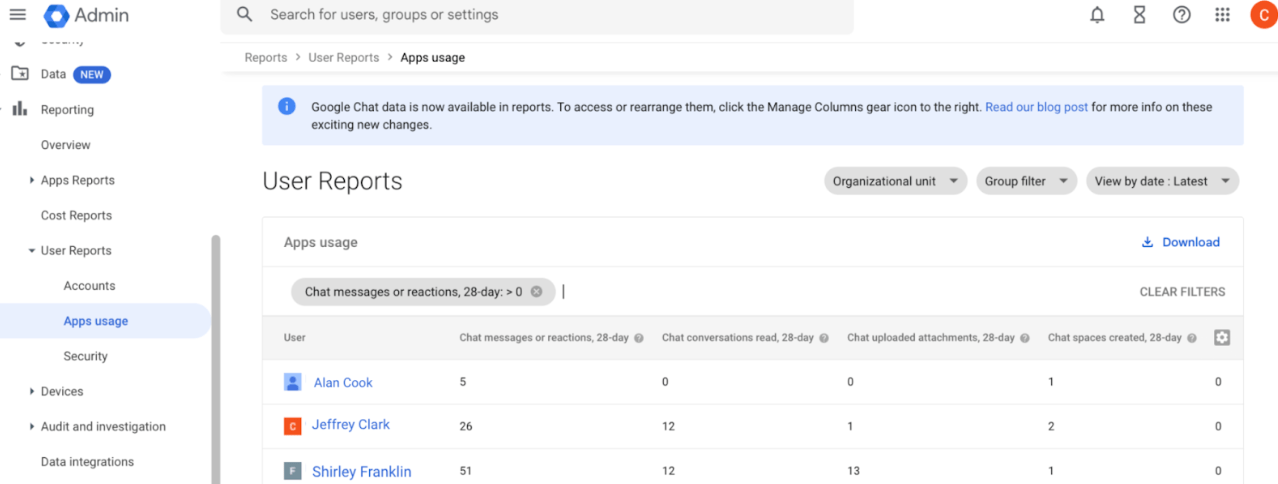
Admins can view user level data for Google Chat, as you can with Gmail, Drive, and other apps today. Admins can also view how many conversations were read, how many messages were sent, how many attachments* were uploaded, and more. They can also sort this information by specific organizational units or groups to assess adoption or usage within specific parts of organization
*Active Spaces and Created Spaces charts may show different numbers from those in Active Rooms and Active Rooms legacy charts. Active Spaces and Created Spaces charts only count conversations of ‘space’ type; Active Rooms and Created Rooms count conversations of space group conversation types.
*Attachments can be viewed in the security investigation tool..
Who’s impacted
Admins
Why it’s important
The updated reporting aligns trackable metrics with the current Chat experience and provides essential data for analyzing and driving adoption, configuring safety features, and more.
Ví dụ: quản trị viên có thể hiểu sâu hơn về cách người dùng của họ tương tác với trò chuyện, phân biệt giữa những người tích cực tham gia (gửi, phản hồi) và những người chủ yếu chỉ đọc tin nhắn. Các nhà lãnh đạo tổ chức có thể sử dụng những hiểu biết này để đánh giá nhu cầu đào tạo sản phẩm thêm để thúc đẩy việc áp dụng. Ngoài ra, việc theo dõi khối lượng tin nhắn được gửi đến người dùng bên ngoài có thể báo hiệu cho quản trị viên rằng cần triển khai các biện pháp an toàn, chẳng hạn như thiết lập các quy tắc ngăn ngừa mất dữ liệu (DLP) để bảo vệ thông tin nhạy cảm.
Additionally, Chat is now represented in app usage reports, alongside other products like Google Drive and Gmail. While each set of apps has their own unique set of metrics, admins now have another data set to draw on when analyzing how their users are interacting with Google Workspace apps
Additional details
With the implementation of these new, information rich charts, we’re planning to remove the following charts on July 1, 2025:
- Active Rooms
- Created Rooms
- Active Users
- Messages Posted
Also note that:
- Some metrics will take time to populate, such as the 7-day or 28-day views.
- If you've used the 'Manage Reports' or 'Manage Columns' features to customize the App Reports or User Reports pages, you'll need to adjust your settings to see the new Google Chat charts and columns. These customization features, which allow you to hide, unhide, and rearrange the order of chats or columns, will prevent the new Google Chat data from automatically appearing in your reports.
Getting started
- Admins
- You can find these charts in the Admin console by going Reporting > Apps Reports > Google Chat. User level reports can be found in the Admin console at Reporting > App Reports > Chat > User Reports. Visit the Help Center to learn more about viewing Apps reports for your organization and viewing user level Apps usage reports..
- End users: There is no end user impact or action required.
Rollout pace
- Rapid Release and Scheduled Release domains: Gradual rollout (up to 15 days for feature visibility) starting on December, 12, 2024.
Availability
- Available to all Google Workspace customers
Related Posts