Hãy hình dung một ngày làm việc điển hình của một nhân viên văn phòng…
New ways to quickly format and organize data with tables in Google Sheets
What’s changing
Google know it can be time consuming to perform repetitive tasks like updating data in a spreadsheet. In addition, maintaining the structure and format of the data can be difficult when there are multiple people updating the document.
Để giúp giải quyết vấn đề này, Google rất vui mừng được giới thiệu bảng trong Google Trang tính. Với bảng, bạn có thể đơn giản hóa và tăng tốc việc xây dựng bảng tính bằng cách đưa định dạng và cấu trúc vào các phạm vi không được sắp xếp. Bằng cách chọn phạm vi dữ liệu của bạn và vào Định dạng > Chuyển đổi thành bảng, Trang tính hiện thực hiện công việc nặng nhọc là định dạng và sắp xếp dữ liệu với thiết kế được trau chuốt bao gồm các loại cột, bộ lọc, mã màu, menu thả xuống và nhiều hơn nữa.
Sau đây là cách sử dụng bảng giúp giảm thời gian bạn thường phải dành để định dạng dữ liệu theo cách thủ công:
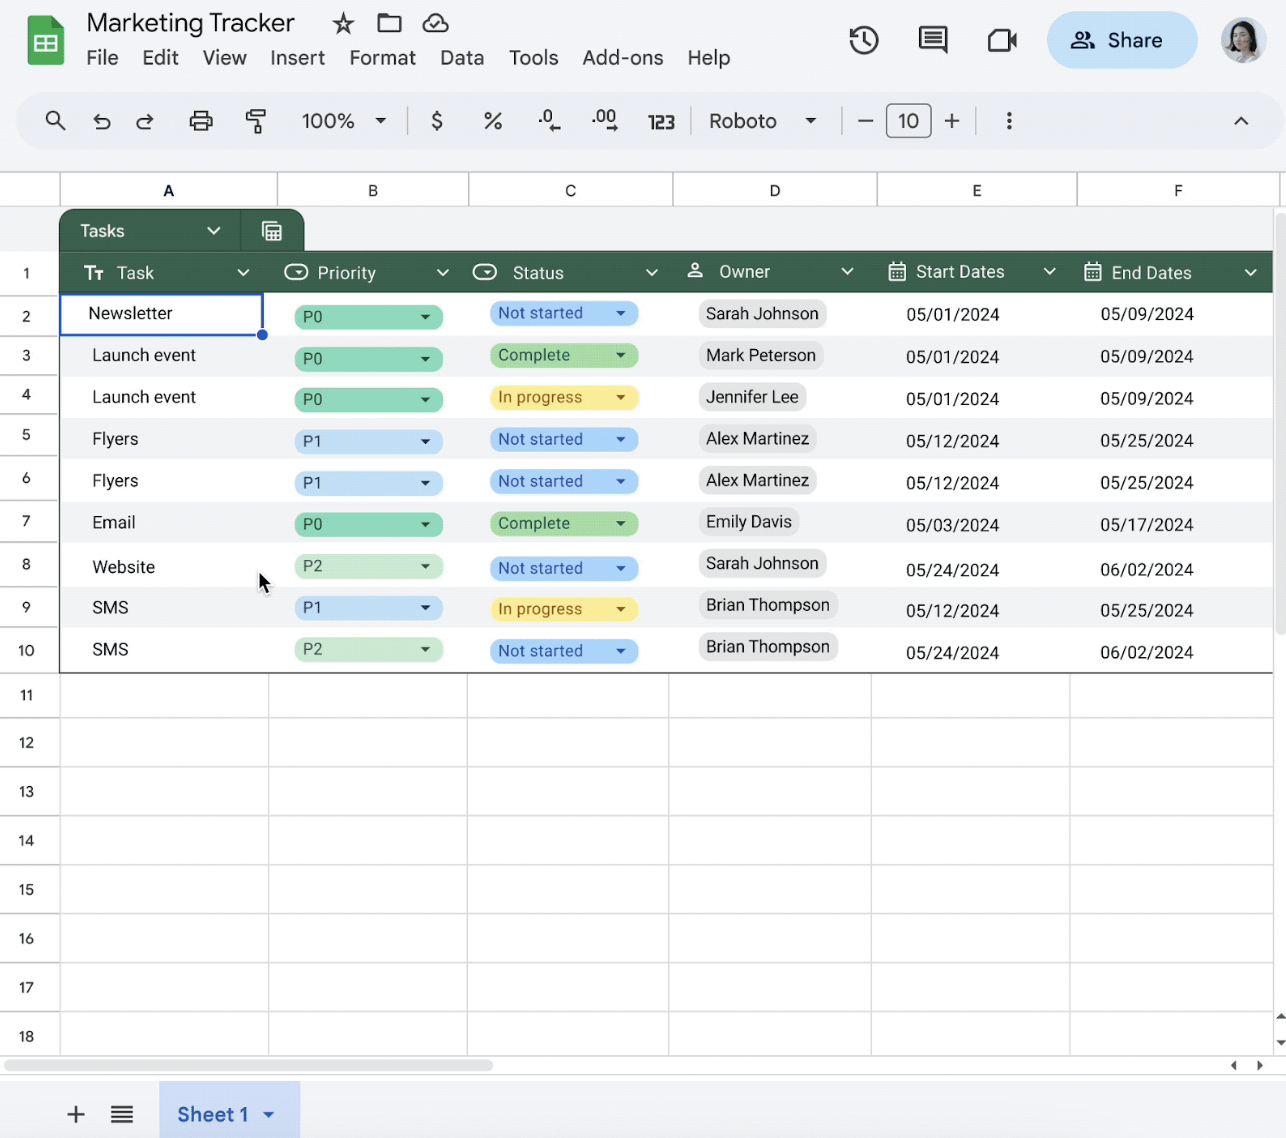
- Auto-applied formatting: When you convert your data to a table, Sheets automatically applies formatting to polish your data so that all inputs are properly aligned, reducing the need for manual changes. You can further customize your table by changing colors, readjusting the row height, and more.
- Column types: For each column, you can set the appropriate column type (e.g., date, currency, dropdown), and your table will make sure all entered data has the right formatting based on the column type. Data entered that does not align with a set column type will result in a warning.
- Unified menu: Above the table, you will see a menu option to manage table-level settings (e.g., adjust table range) and take action (e.g., create a filter view for your table).
- Table references: Table references are a special way to refer to a table or parts of a table in a formula. When you convert your data to a table, Sheets provides a name for the table and each column header. When you reference table elements by name, the references update whenever you add or remove data from the table. For example: Instead of explicit cell references: =COUNTIF(B2:B10, “P0”), you can use table references: =COUNTIF(Task_tracker[Priority], “P0”).
When you are using tables, you’ll also have access to our new type of view, group by, where you can aggregate your data into groups based on a selected column. For instance, you can decide to group all data at the same priority level in one place, as shown below.
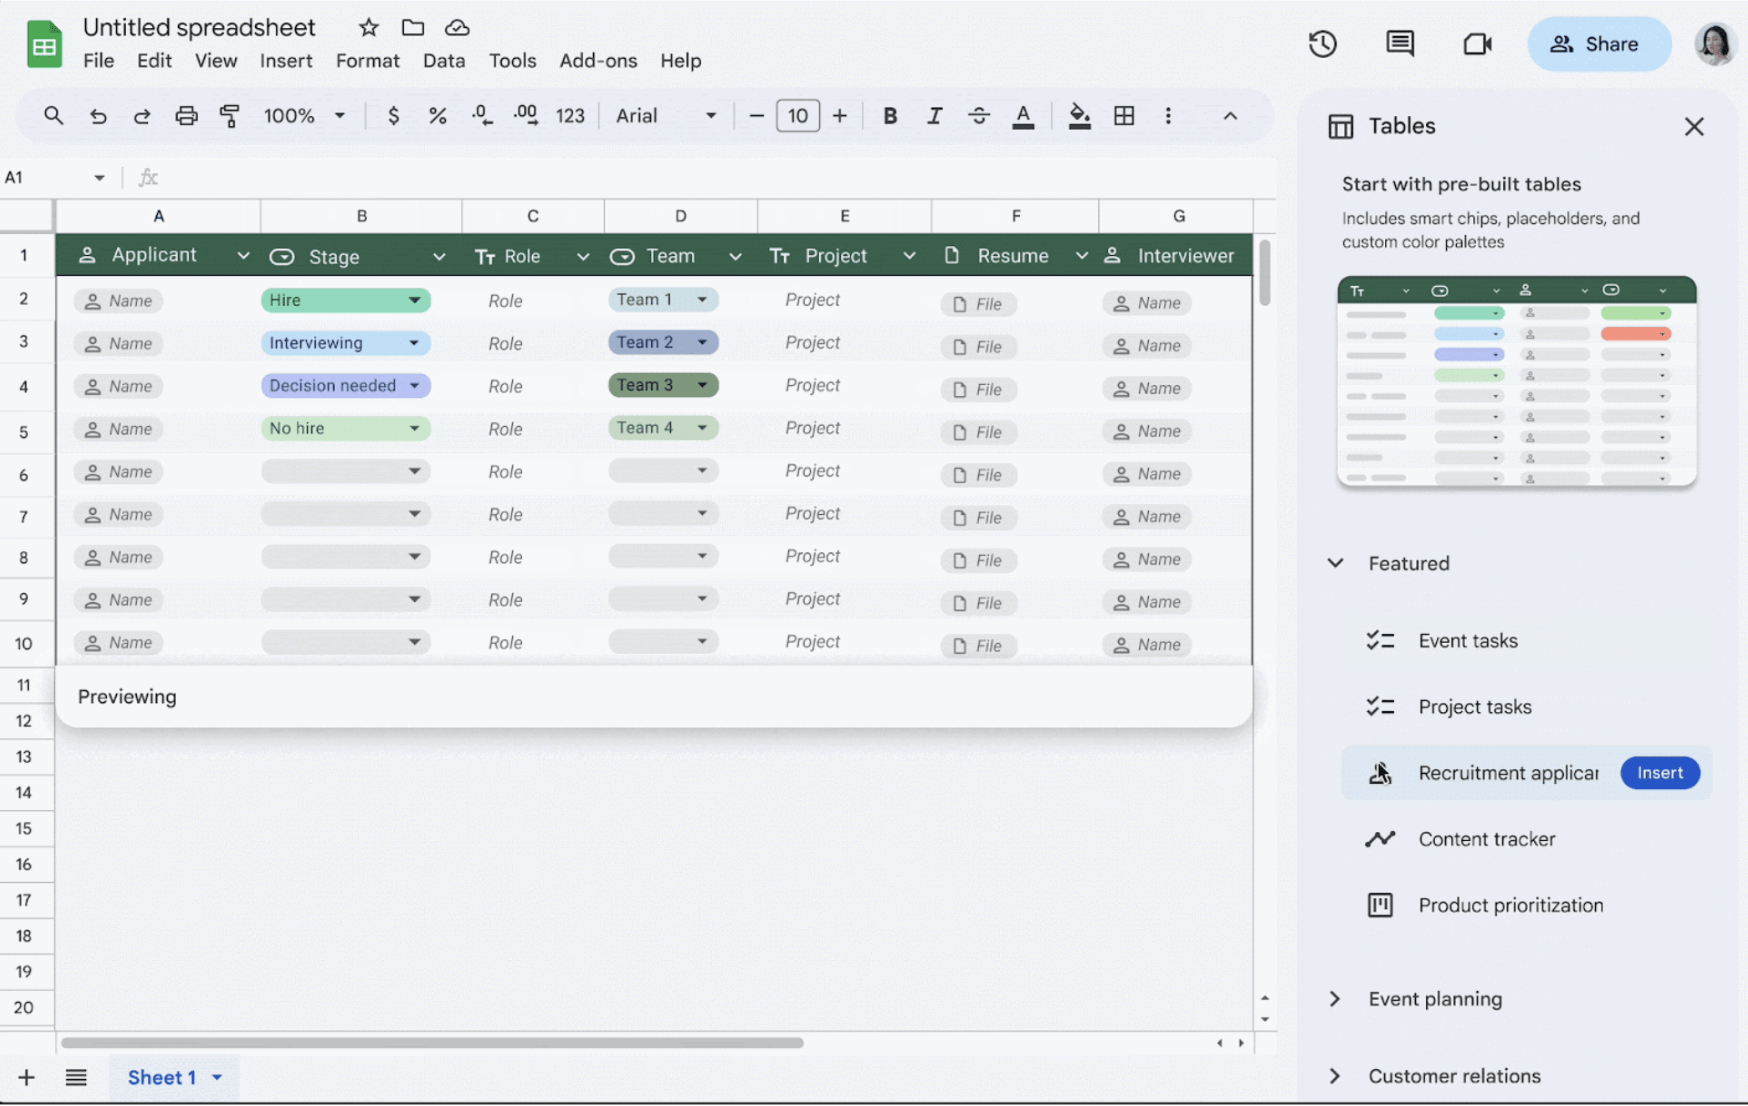
Google is also introducing pre-built tables that you can populate with common data types for everyday tasks like project management, inventory management, event planning and more. Now with pre-built tables, you never have to build a spreadsheet from scratch again.
Who’s impacted
End users
Why it’s important
Tables will transform the way teams organize their data, simplify data creation, and reduce the repetitive tasks needed to format, input, and update data. They also allow teams to confidently share data widely while maintaining its integrity and consistency.
Tables are Googlell suited for tracking and organizing information such as project tracking, event planning, and inventory management.
Getting started
- Admins: There is no admin control for this feature.
- End users: Visit the Help Center to learn more about using tables in Google Sheets.
Rollout pace
- Rapid Release domains: Extended rollout (potentially longer than 15 days for feature visibility) starting on May 8, 2024, with expected completion by June 13, 2024
- Scheduled Release domains: Gradual rollout (up to 15 days for feature visibility) starting on June 13, 2024
Availability
- Available to all Google Workspace customers, Google Workspace Individual subscribers, and users with personal Google accounts
Source: Gimasys
Related Posts