


Gemini 4 Argon mang lại hiệu năng cấp độ biên giới (frontier performance) trong các…
Generate and edit visuals with Gemini in Google Docs
You can now create and edit images, diagrams, and infographics directly alongside your text using Gemini in Google Docs. These images leverage the context of your document, so you can generate relevant visuals to accompany your writing without ever leaving Docs or relying on external tools. Plus, you can refine your existing visuals and graphics using simple natural language prompts.
With this new functionality, you can:
- Create rich infographics or diagrams summarizing your docs: Ask Gemini to "Add a diagram providing an overview of the proposal at the top of my doc" or "Create a rich infographic visually summarizing my doc."
- Refine existing visuals: Use natural language to "Change the aspect ratio to 16:9" or "Make the style more aesthetic to match the rest of the document."
- Create or edit multiple visuals at once: Ask Gemini to add infographics in each key section, or update the style of multiple visuals at once.
You can access these capabilities from the bottom bar or the Gemini side panel in Google Docs.
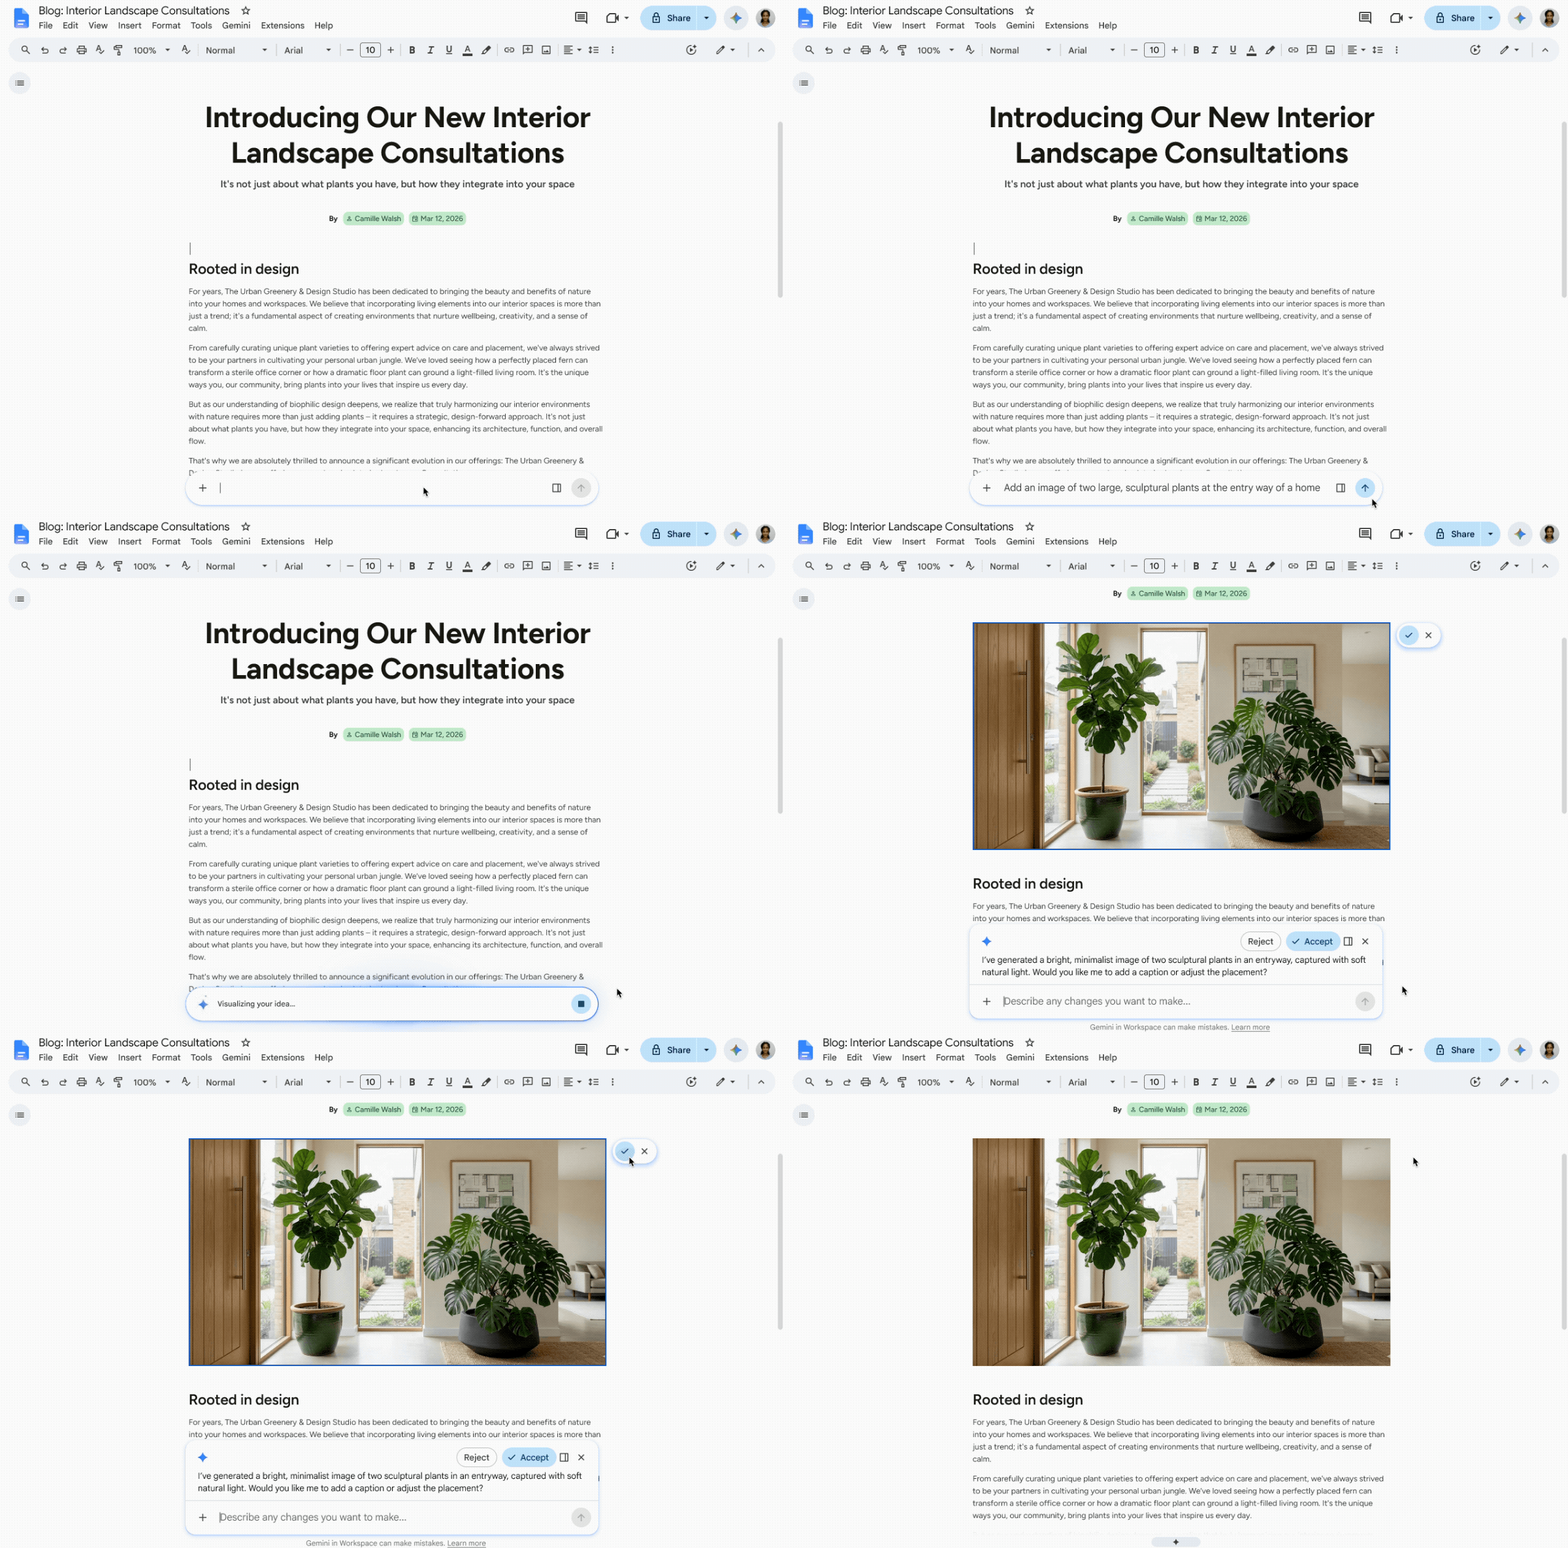
Note: This feature is currently supported on the web only.
Getting started
- Admins: These features are available by default if Gemini for Workspace in Drive is enabled.
- End users: You must have Workspace smart features enabled to use these features.
Rollout pace
- Rapid Release and Scheduled Release domains: Gradual rollout (up to 15 days for feature visibility) starting on July 28, 2026
Availability
- Business: Business Standard and Plus
- Enterprise: Enterprise Standard, and Plus
- Education: Education Plus
- Consumer: Google AI Pro and Ultra
- Education Add-ons: Google AI Pro for Education; Teaching and Learning
Related Posts