Google xin giới thiệu Veo 3.1 Lite, mô hình video tiết kiệm chi phí nhất…
Cloud Monitoring metrics, now in Managed Service for Prometheus
According to a recent CNCF survey, 86% of the cloud native community reports that they use Prometheus for observability. As Prometheus becomes more of a standard, an increasing number of developers are becoming fluent in PromQL, Prometheus’ built-in query language. While it is a powerful, flexible, and expressive query language, PromQL is typically only able to query Prometheus time series data. Other sources of telemetry, such as metrics offered by your Cloud provider or metrics generated from logs, remain isolated in separate products and might require developers to learn new query tools in order to access them.
Introducing PromQL for Google Cloud Monitoring metrics
Các chỉ số Prometheus là không đủ để có được một cái nhìn toàn cảnh về hoạt động trên Cloud của bạn. Cloud Monitoring cung cấp hơn 1.000 chỉ số miễn phí cho phép bạn theo dõi và cảnh báo về việc sử dụng các dịch vụ Google Cloud của mình, bao gồm các chỉ số cho Compute Engine, Kubernetes Engine, Load Balancing, BigQuery, Storage Cloud, Pub/Sub etc. Google is pleased to announce that you can now query all Cloud Monitoring metrics using PromQL and Managed Services for Prometheus, including Google Cloud system metrics, Kubernetes metrics, Log-based metrics and custom metrics.

Because we built Managed Service for Prometheus on top of the same planet-scale time series database as Cloud Monitoring, all your metrics are stored together and are queryable together. Metrics in Cloud Monitoring are automatically generated when you use Google Cloud services at no additional cost to you. View all your metrics in one place with the query language that developers already know and prefer, opening up possibilities such as:
- Correlating spikes in traffic with Redis cache misses using Cloud Load Balancing metrics and Prometheus’ Redis exporter
- Graphing Cloud Logging’s logs-based metrics alongside Prometheus metrics
- Alerting on your Compute Engine utilization or your Pub/Sub backlog size using PromQL and Managed Service for Prometheus’ rule evaluation
- Replace paid Istio metrics with Google Cloud Istio or Anthos's reach Service Mesh is free equivalent
Exposing these metrics using PromQL means that developers who are familiar with Prometheus can start using all time series telemetry data without first having to learn a new query language. New members of your operations team can ramp up faster, as many industry hires will already be familiar with PromQL from previous experience.
Why Managed Service for Prometheus
In addition to PromQL for all metrics, Managed Service for Prometheus offers open-source monitoring combined with the scale and reliability of Google services. Additional benefits include:
- Hybrid- and multi-cloud support, so you can centralize all your metrics across clouds and on-prem deployments
- Two-year retention of all Prometheus metrics, included in the price
- Cost-effective monitoring on a per-sample basis
- Easy cost identification and attribution using Cloud Monitoring
- Your choice of collection, with managed collection for those who want a completely hands-off Prometheus experience and self-deployed collection for those who want to keep using existing Prometheus configs
How to get started
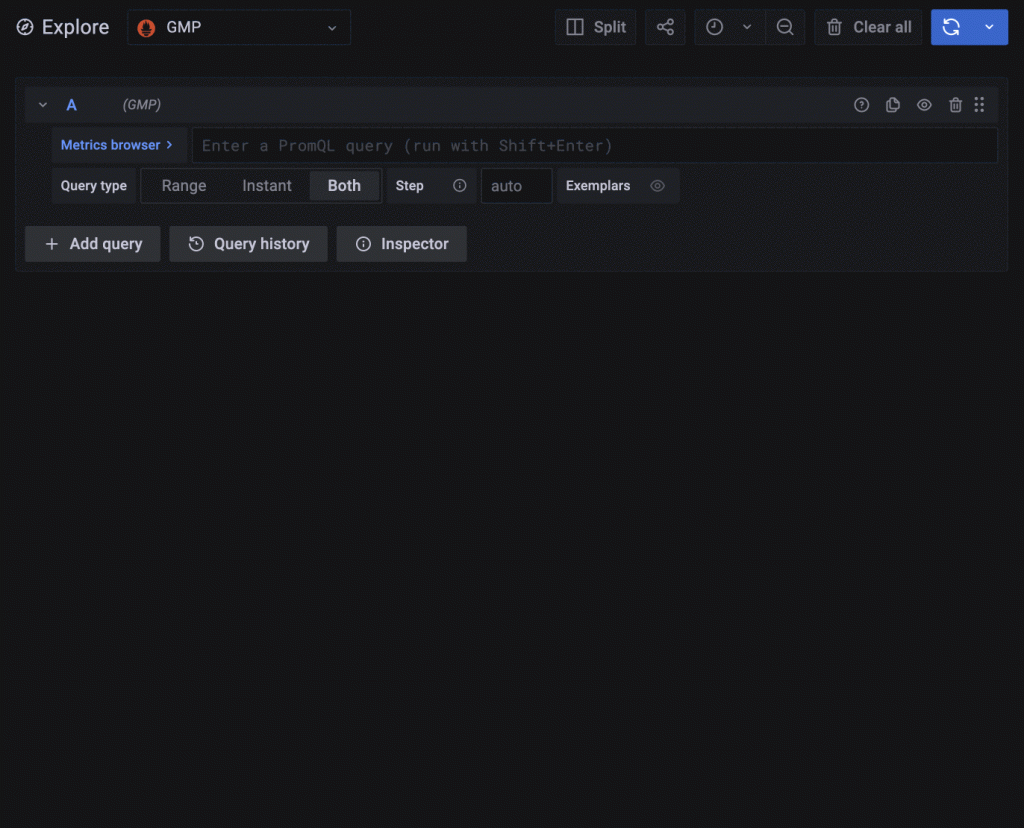
You can query Cloud Monitoring metrics with PromQL using the interactive query page in Cloud Console or Grafana. To learn how to write PromQL for Google Cloud metrics, see Mapping Cloud Monitoring metric names to PromQL. To configure a Grafana data source to be able to read all of your metrics in Cloud Monitoring, see Configuring the Query UI in the Managed Services for Prometheus documentation.
If your business is interested in the Google Cloud Platform then you can connect to Gimasys - Google Premier Partner - for consulting solutions according to the unique needs of your business. Contact now:
- Gimasys – Google Cloud Premier Partner
- Hotline: Ha Noi: 0987 682 505 – Ho Chi Minh: 0974 417 099
- Email: gcp@gimasys.com
Source: Gimasys


