Nhờ công nghệ lõi "Agentic AI" (AI tự chủ), Trí tuệ nhân tạo đang tiến…
Monitor the health of your VM fleets in the Compute Engine console
Many Infrastructure Operators need to manage large fleets of VMs. This task often involves gathering various key signals, identifying outliers, drilling down to find root causes, and fixing issues. This is usually a time-consuming process for operators since they need to switch between multiple pages to gather necessary information.
We are excited to announce that the Observability tab trong trang VM List page của Compute Engine console đã đạt được phổ cập chung. Observability tab là một cách dễ dàng để theo dõi và điều chỉnh hiện trạng của nhóm máy ảo — tab này cung cấp các số liệu về tình trạng chính và ghi log ngay khi sử dụng, cũng như làm nổi bật các điểm bất thường trong hệ thống của bạn. Bạn có thể nhanh chóng hiểu rõ hơn về CPU, memory, network, disk, live processes, system events và live logs trong cùng một giao diện.
Observability-in-context at a fleet level
This new fleet level view lets you understand your VMs more holistically by 1) identifying VM outliers based on key metrics such as CPU, memory, and 2) seeing cross-fleet trends around high-resource processes or network latencies by destination.
Metrics
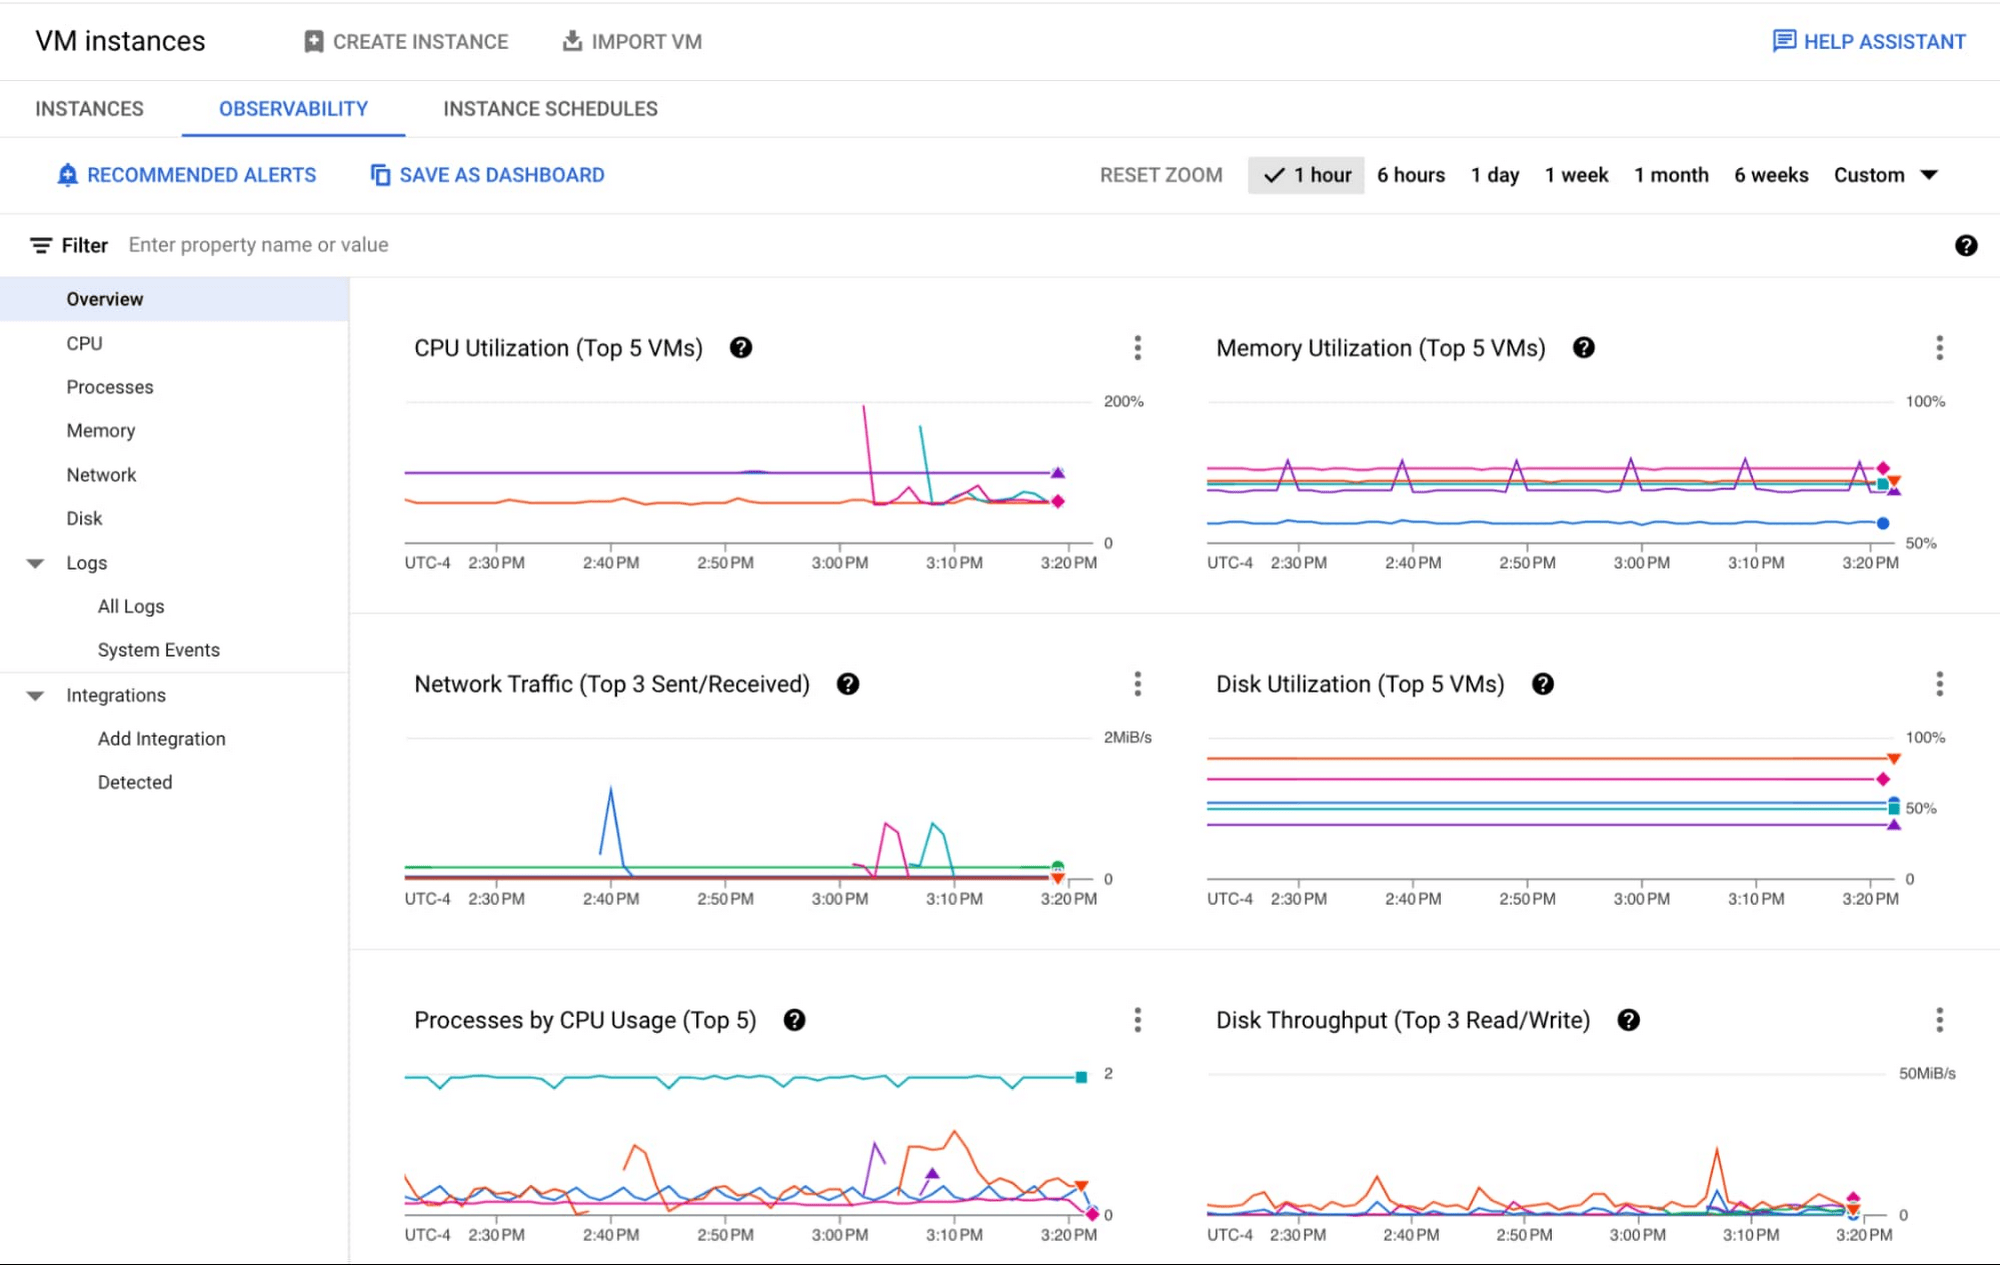
The Observability tab helps you visualize key health metrics without configuration. Here are all the metrics offered out-of-the-box and their example use cases:
CPU
- CPU Utilization, vCPU Core Usage: Troubleshoot application performance issues by identifying VMs running out of CPU resources. See Troubleshooting VM Performance
- Processes by CPU Usage: Identify top processes by CPU usage for pinning down the root cause of an issue or to identify optimization opportunities.
- System Load per vCPU: If the number is close to 1, it could indicate a need to scale up your VM to prevent performance issues
- Unused vCPU Cores: Discover cost saving opportunities from VMs that are underusing CPU resources
Processes
- Live processes by CPU Usage, Memory Usage, Disk Throughput: Identify top processes by CPU, Memory, or Disk Throughput to find optimization opportunities or unexpected resource consumers.
- Live processes by CPU per VM, Processes by Memory per VM, Processes by Disk Throughput per VM: Find sample VMs that are running the top CPU/Memory/Disk-consuming processes
Memory
- Memory Utilization, Memory Bytes Used: Troubleshoot application performance issues by identifying VMs running out of Memory
- Memory Bytes Unused: Discover cost saving opportunities from VMs that are underusing Memory resources
- Processes by Memory: Identify top processes by Memory usage
- Memory by State (across VMs): Learn aggregated sizes of free, used, cached, buffer, and slab memory across your fleet
Network
- Network Traffic: Identify “top talkers” across your fleet for optimizing costs
- Sent Traffic by Destination Type (GCP/External/Google), Sent External (or different project), Sent Cross-region and cross-zone: Discover top network cost contributors (see Network costs)
- RTT by Destination Type (GCP/External/Google): Troubleshoot application performance issues by identifying abnormal latency (RTT)
- Firewall Packets Denied (Highest Variance): Discover anomalies in incoming traffic (e.g. a sudden surge in denied traffic)
Disk
- Disk Utilization: Troubleshoot application performance issues by identifying VMs running out of Disk space
- Disk Throughput, Disk IOPS: Monitor disk performance by seeing outliers VMs across throughput and IOPS.
- I/O Size, I/O Latency, Queue length, CPU I/O Wait %: Dive deeper into Disk I/O performance issues by seeing I/O size, latency and queue length. See Optimizing persistent disk performance for how to tune your workloads for maximum performance across these dimensions.
NoteMany of the metrics such as CPU and network are provided for free and automatically collected by the Compute Engine infrastructure. Other metrics such as memory, disk utilization, and processes require the Ops Agent Ops Agent and may be chargeableCloud Monitoring Non-chargeable and Chargeable Metrics).
Logs
The Logs section provides out-of-the-box logs from your VM fleet, and you can easily filter the logs by keywords, VM ID, severity level, or suggested queries. You can also gain insights into important system events, such as host machine maintenance events (Live Migrations or host errors), Spot VMs preemptions, v.v.
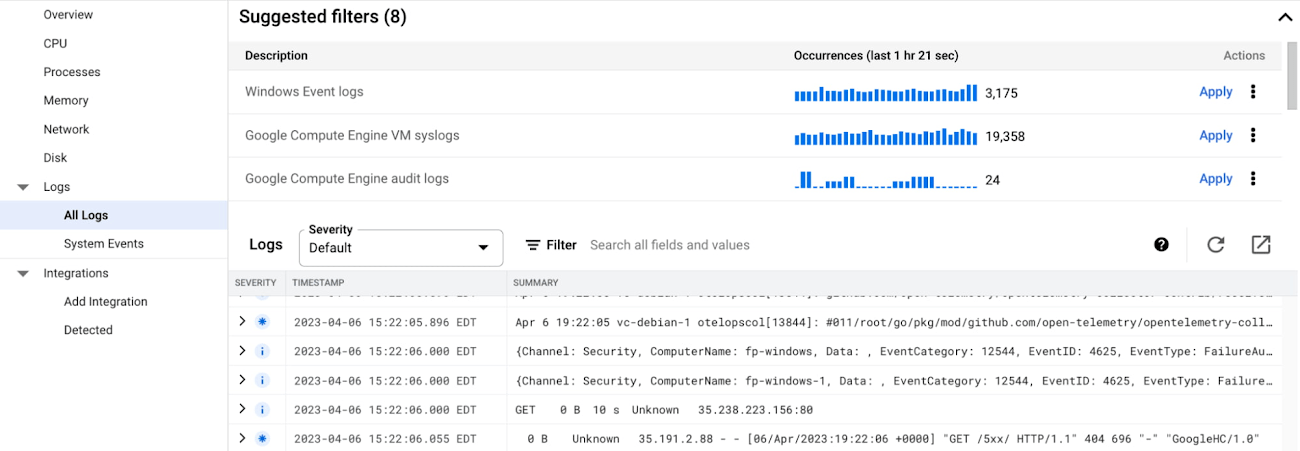 you need more advanced log analysis, simply click on the top-right icon to navigate to Cloud Logging - the fully managed, real-time log management with storage, search, analysis and alerting at exabyte scale.
Drilling down into a single VM
To troubleshoot a specific VM, you can click a chart to pin the hover card and then click on the VM you want to investigate, as shown below:
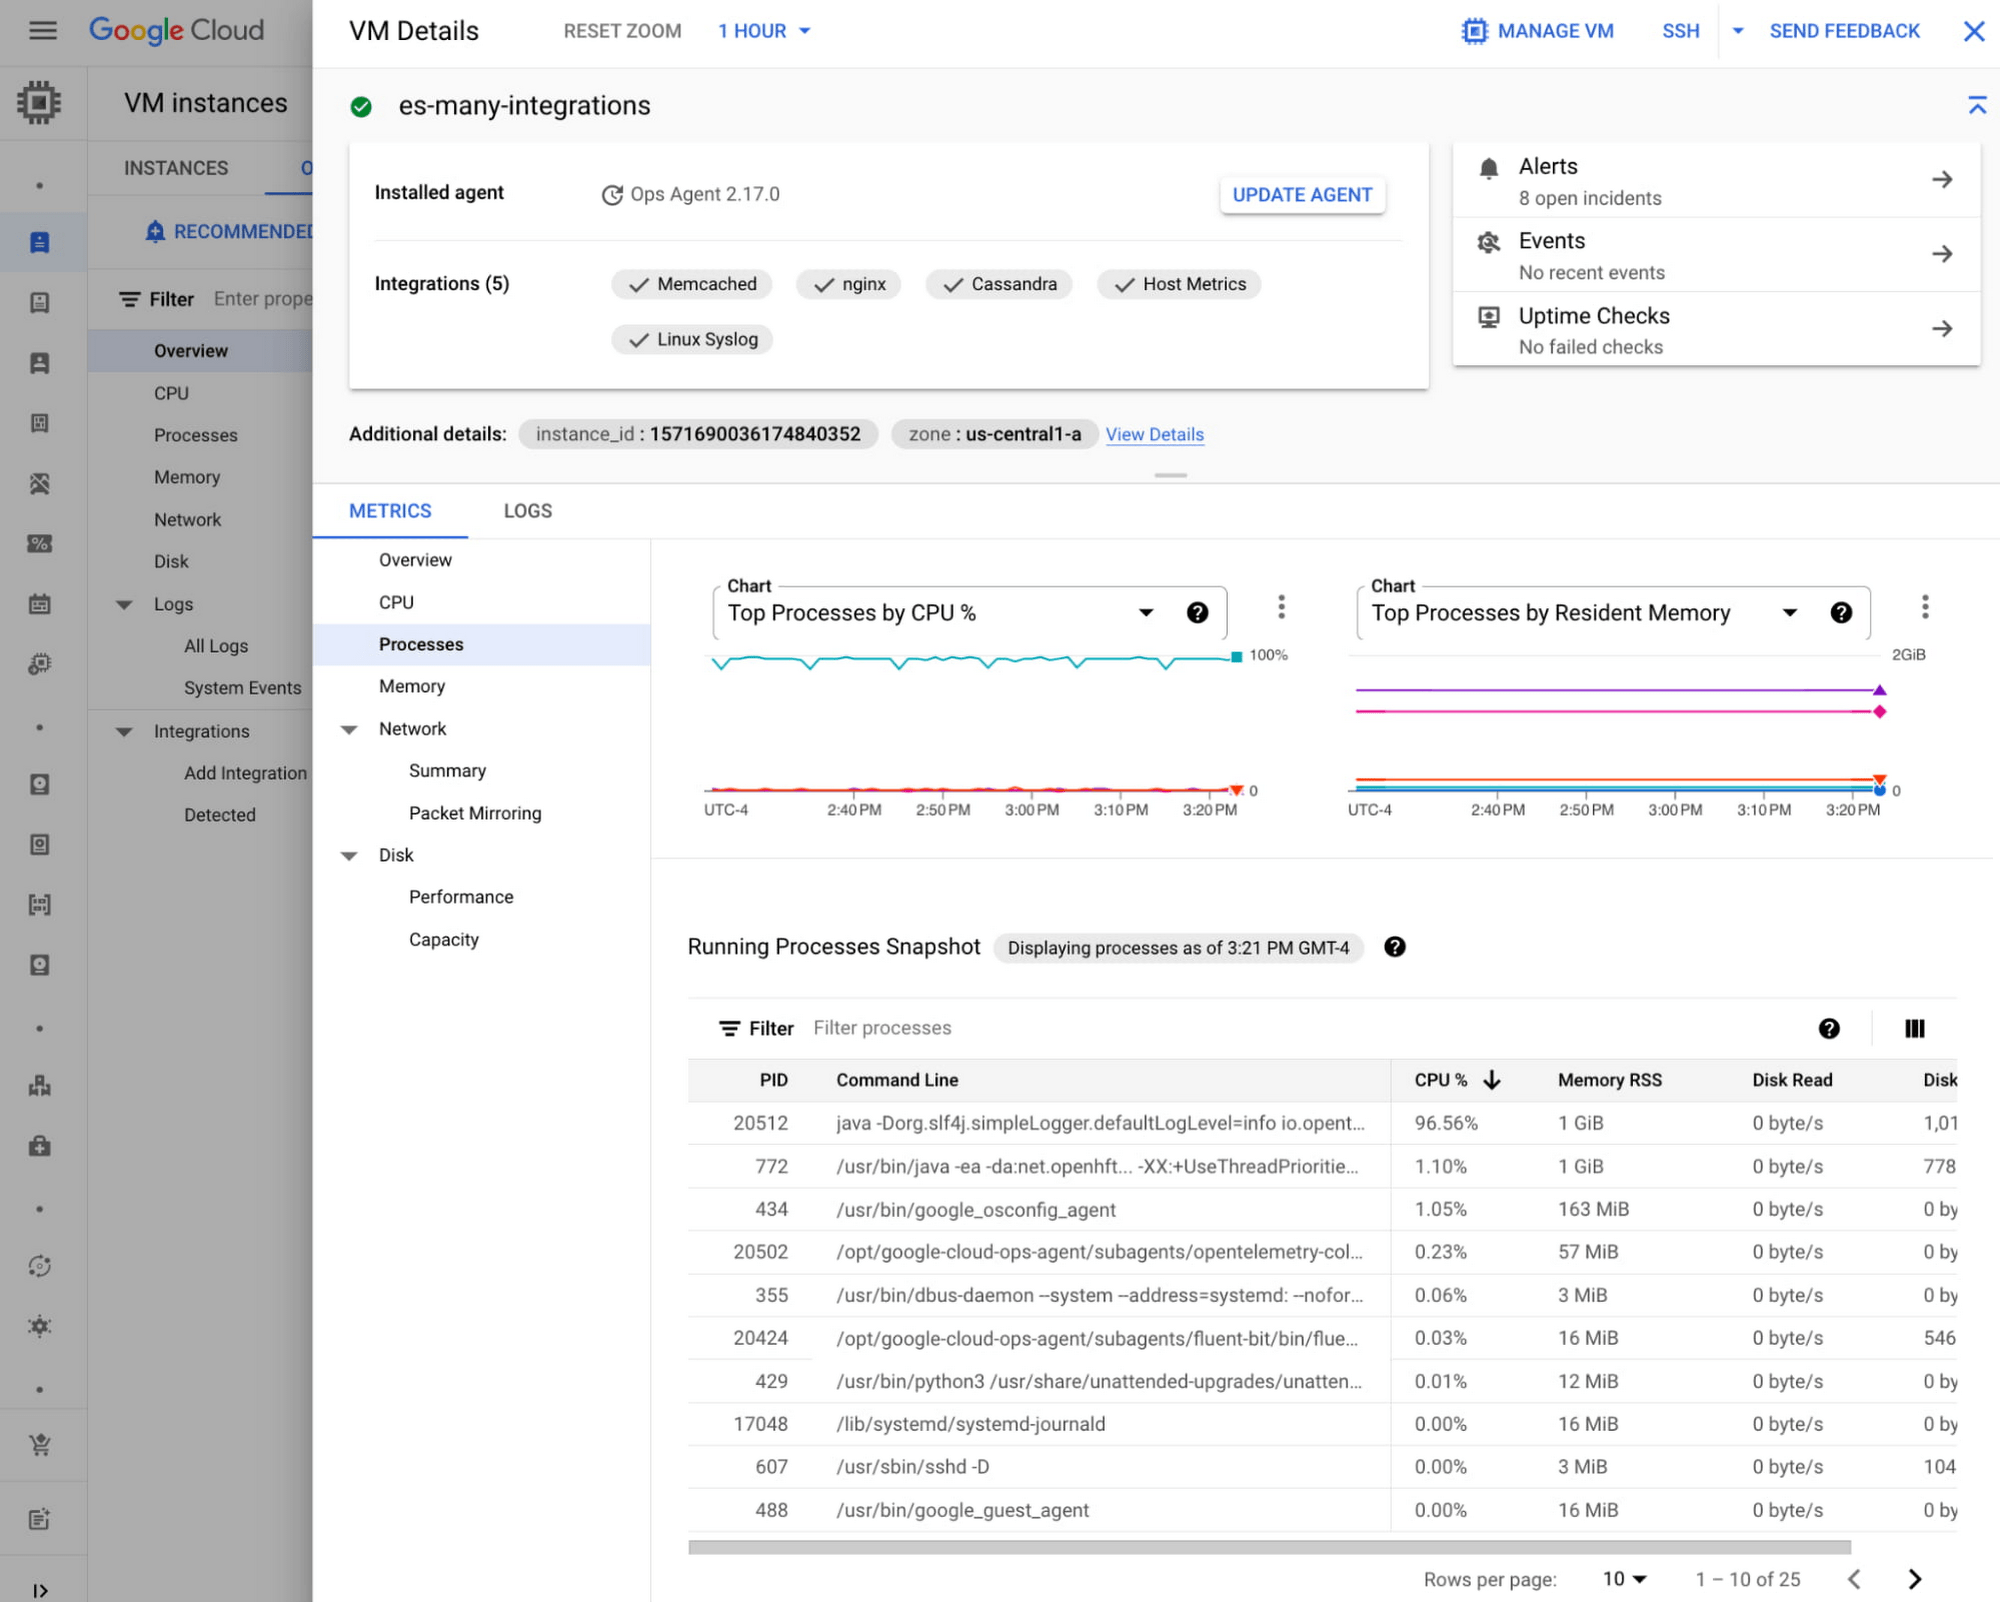
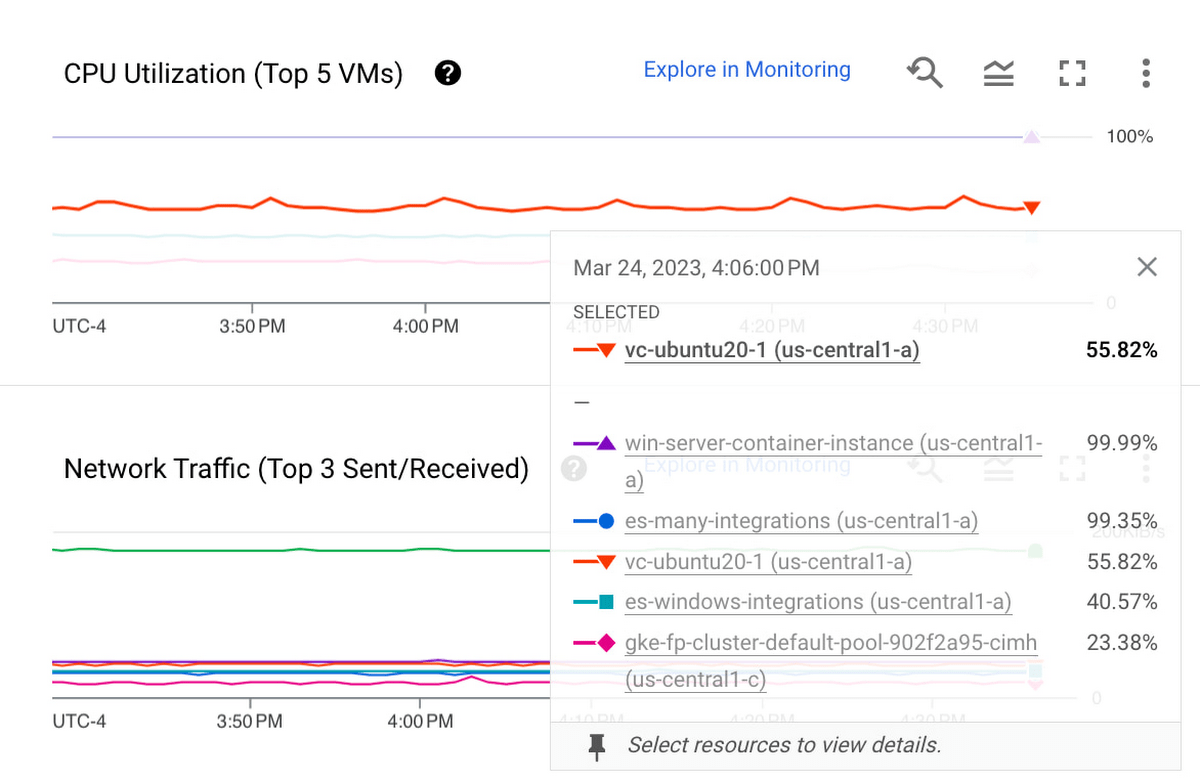 After clicking on the VM, you will find the following VM details - metrics, logs, processes, open incidents, uptime check, shortcuts to SSH to or manage the VM, and so on.
Discover Application Integrations
On top of infrastructure, you can also start monitoring your applications such as NGINX or MySQL here in the Observability tab. The Application Integrations section guides you to monitor third-party applications using the Ops Agent.. For each of the integrations, you can find out more about its collected metrics, configuration guides, and related sample dashboards.
Discover Recommended Alert Policies
Bạn có muốn nhận thông báo khi có sự cố xảy ra với máy ảo của mình không?
Do you want to get notified when something goes off the rail with your VMs? The Recommended Alerts section provides out-of-the-box alert policy templates on key health metrics, such as CPU and memory utilization. You can set up these policies across your fleet with only a few clicks.
Cloud has been and is an inevitable trend in the technology development and optimization system of enterprises. Gimasys - Premier Partner of Google in Vietnam is the unit providing, consulting the structure, designing the optimal Cloud solution for you. For technical support, you can contact Gimasys - Premier Partner of Google in Vietnam at the following information:
- Hotline: 0974 417 099 (HCM) | 0987 682 505 (HN)
- Email: gcp@gimasys.com
Source: Gimasys
Related Posts