Nhờ công nghệ lõi "Agentic AI" (AI tự chủ), Trí tuệ nhân tạo đang tiến…
Understand and optimize your BigQuery analytics queries using the query execution graph
BigQuery provides strong query performance, but it is also a complex distributed system with many internal and external factors that can affect query speed. When your queries are running slower than expected or slower than previous runs, understanding what went wrong can be challenging.
The query execution graph provides an intuitive interface for inspecting query execution details. By using it, you can review the query plan information in graphical format for any query, whether running or completed.
You can also use the query execution graph to get performance insights for queries. Performance insights provide best-effort suggestions to help you improve query performance. Since query performance is multi-faceted, performance insights might only provide a partial picture of the overall query performance.
Execution Graph
When BigQuery executes a query job, it converts the declarative SQL statement into a graph of execution, broken up into a series of query stages, which themselves are composed of more granular sets of execution steps. The query execution graph provides a visual representation of the execution stages and shows the corresponding metrics. Not all stages are made equal. Some are more expensive and time consuming than others. The execution graph provides toggles for highlighting critical stages, which makes it easier to spot the potential performance bottlenecks in the query.
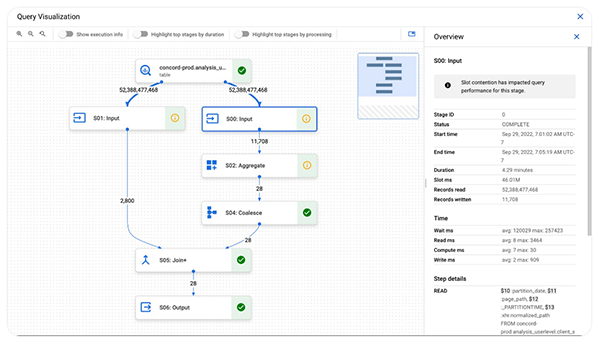
Query performance insights
In addition to the detailed execution graph BigQuery also provides specific insights on possible factors that might be slowing query performance.
Slot contention
When you run a query, BigQuery attempts to break up the work needed by your query into tasks. A task is a single slice of data that is input into and output from a stage. A single slot picks up a task and executes that slice of data for the stage. Ideally, BigQuery slots execute tasks in parallel to achieve high performance. Slot contention occurs when your query has many tasks ready for slots to start executing, but BigQuery can't get enough available slots to execute them.
Insufficient shuffle quota
Before running your query, BigQuery breaks up your query's logic into stages. BigQuery slots execute the tasks for each stage. When a slot completes the execution of a stage's tasks, it stores the intermediate results in shuffle. Subsequent stages in your query read data from shuffle to continue your query's execution. Insufficient shuffle quota occurs when you have more data that needs to get written to shuffle than you have shuffle capacity.
Data input scale change
Getting this performance insight indicates that your query is reading at least 50% more data for a given input table than the last time you ran the query and hence experiencing query slowness. You can use table change history to see if the size of any of the tables used in the query has recently increased.
What’s next?
Google will continue to work on improving chart visibility. They are currently working on adding additional metrics for each step, and adding more performance insights will make query diagnostics significantly easier. Google is just getting started!
Contact Gimasys for advice on a transformation strategy that is right for your business situation and to experience the free Google Cloud Platform service:
- Hotline: Hanoi: 0987 682 505 – Ho Chi Minh: 0974 417 099
- Email: gcp@gimasys.com
Source: Gimasys
Related Posts