Trong quá trình vận hành, các chuỗi hoạt động như họp trực tuyến, đào tạo…
10 lessons learned from Looker's JOIN@Home conference 2021
JOIN @ Home It's an incredible celebration of what the Looker community has achieved last year, and I'm so proud to be a part of it. Renowned leaders in the data world shared their successes, tips and plans for the future. In the spirit of continued learning, I've summarized the top two lessons from each keynote. They come with illustrations recorded live during lessons by a local artist.
“Honoring Data Heroes – Transforming Our World With Data”
Our opening keynote featured a number of inspirational data professionals who use Looker in their work every day to see trends, drive decision making, and grow their client base.
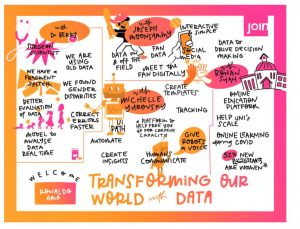
Some of their key points are:
- You can use analytics to make changes for greater benefit.
Surgical scientist Dr. Cherisse Berry spoke about cross-referencing healthcare outcome data such as survival rates after trauma care, how long patients wait before being seen, and whether the patient is ill. whether demographic data are appropriately analyzed to identify gender and racial disparities in health care. For example, she found that women with severe injuries received less trauma care than men. Because her analysis has made the difference known, informed decisions and actions can be taken to bring more parity to New York State's trauma care system. - Provide templates to make it easier for many users to provide insights, especially non-technical people.
Michelle Yurovsky of UIPath, an automation platform that helps customers avoid repetitive tasks, shared one of the main ways UIPath engages customers: by providing sample dashboards that respond to requests Frequently asked questions about automation. Customers get helpful insights as soon as they click on the product. They can copy and modify the templates according to their business needs, so they are less afraid to start working with analytics – especially if they have no prior dashboard building experience.
*Source: Coursera internal data, November 2021.
“Developing a better future with data”
This keynote looks to the future of analytics.
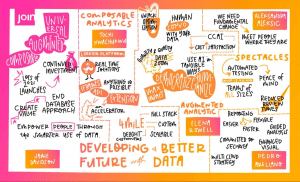
The two main topics are:
- Analytic capabilities make application development faster, easier, and more accessible.
Meta analytics means creating a custom analytical solution using off-the-shelf components. You have access to meta-analysis with Looker through extension frame, which provides downloadable components that you can use to build your apps right on top of the Looker platform. The filter and visualization components let you easily create the visual side of these data experiences. - Augmented analytics makes it easier to handle the scale and complexity of data in modern business – and make smarter decisions about possible future outcomes.
Augmented analytics generates complex analytics, generated by integrating machine learning (ML) and artificial intelligence (AI) with data. The Looker team worked to make augmented analytics more accessible to everyone this year. In particular, the new Blocks give you access to ML insights through a familiar Looker interface, allowing you to faster prototyping ML and AI driven solutions. Eg: Block time series prediction (use BigQuery ML) can be installed to give analysts more insight into future demand for better inventory and supply chain management. CCAI Insights gives call centers access to Contact Center AI Insights data with analytics they can use immediately.
“The Looker Difference”
Product Manager Ani Jain and Tej Toor highlighted many recent features that you may find useful for enabling and enabling users with Looker.
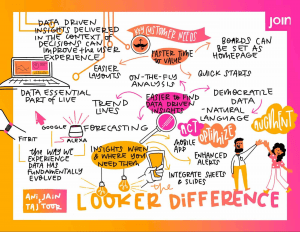
Here are two highlights:
- Giving your team better starting points can lead to more engagement with analytics.
Two improved ways to dig into insights from this year: Quick start and board improvements. Quick Starts act as pre-built Explore pages that your users can open with one click, making ad hoc analysis more accessible and less intimidating. They're also a convenient way to save an analysis you find yourself doing often – and they even save your filter settings. And with new navigation improvements in Looker, tables easier to find and use. You can now pin links to a board, whether it's a dashboard, an Theme, an Explore or something else, including external links. So begin. Try creating a useful data center for your team with a new table. - Natural Language Processing and Looker can help you understand relationships in data quickly.
A great example of this is Healthcare NLP API Block, creating an interactive user interface where healthcare providers, payers, pharmaceutical companies and others in the healthcare industry can easily access detailed information smarter. Basically, This Block works on API GCP Healthcare NLP, an API that provides pre-trained natural language models to extract medical concepts and relationships from medical text. The NLP API helps to structure the data, and the Viewer Block can make the insights inside that data more accessible.
“Build and Monetize Custom Data Experiences with Looker”
Pedro Arellano, Product Manager of Looker, and Jawad Laraqui, CEO of Data Driven, a Boston-based consulting firm, chatted about embedded analytics and the remarkable speed with which one can build data applications with Looker and monetization strategies.
Points you don't want to miss from this:
- Looker can help you enhance existing customer experiences and create new revenue streams with embedded data.
For example, you can provide personalized insights for customers interacting with your products or automate business processes, such as using data to trigger the order process. service when there is a problem with a particular product. Embedding data in these ways can make the customer experience smoother. To take it a step further, you can monetize the data product you build to help generate new revenue streams. - Building a Looker Marketplace can help you find more customers for your app and can promote a better user experience.
Jawad compared the use of extension frame to build the Looker Marketplace like having an app in the Apple store. Market Participation is a way for customers to organically find and use his products, while helping to provide end-users with a streamlined experience. “We can quickly copy and paste our entire app from a standalone website into something inside Looker,” he says. And we did it quickly — one developer did it in a day. It's a lot easier than you think, so I encourage everyone to give it a try. Just go build! ”
“Looker for Modelers: What News and What's Next”
Adam Wilson, Product Manager of Looker, mentions the latest upgrades and future plans for Looker's semantic data model. This layer sits on top of many data sources and standardizes common metrics and definitions, so it can be managed and included in a modern, interactive business intelligence (BI) dashboard that is integrated with each other. built-in, connected to familiar tools like Google Sheets and other BI tools where users work—we call this the unified semantic model.
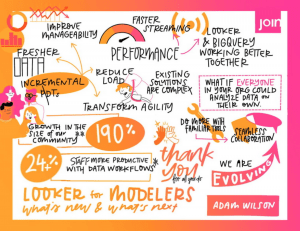
Capabilities to watch out for:
- Leverage Persistent Derived Table (PDT) upgrades to facilitate the end-user experience.
You can use increased PDTs to capture data updates without rebuilding the entire table, which means your users get new data more often with a lower load on your data warehouse. And now being able to validate PDT build status in development mode gives you the visibility you need to determine when to roll out updates to product. Soon, you'll be able to perform impact analysis on proposed changes with visual dependencies between PDTs. - Reach users where they are with Connected Sheets and other BI tools.
Soon, you'll be able to explore Looker data in Google Sheets and share charts to Slides. And with Governed BI Connectors, Looker can act as a trusted source for users accustomed to interacting with data in Tableau, Power BI, and Google Data Studio. You can Subscribe to listen when Connected Sheets and Looker integration integration is available or separately to Heard about preview availability for Governed BI Connectors..
*Source: Total Economic Impact™ by Looker, Forrester Consulting, June 2021.
A study commissioned by Forrester Consulting on behalf of Google Cloud
** Source: Google Community Data, December 2020, 2021
Source: Gimasys
Related Posts