Sự bùng nổ của truyền thông đa phương tiện đã biến video thành kênh tương…
Instructions for using Cloud Monitoring for Compute engine
Along with Cloud Logging and Trace managed services, Cloud monitoring (formerly stackdriver monitoring) is a complete set of tools integrated in Google Cloud's operations suite to help technology engineers better manage and control system applications running on Google Cloud Compute engine.
What is cloud monitoring (stackdriver monitoring)?
Cloud Monitoring Google Cloud's operations suite provides visibility into the performance, uptime, and overall health of applications running in the Cloud. At the same time, it also supports collecting data, events and metadata from services Google Cloud GCP, probe storage uptime, application instrumentation, and common application components.
Cloud Monitoring visualizes collected data through charts and dashboards, and generates alerts to instantly notify you when metrics fall outside expected ranges.
Through Cloud monitoring, management engineers will find answers to the following questions:
- What is the usage load on your service?
- Is your website responsive?
- Is your service working well?
Instructions for using Monitoring (stackdriver monitoring) for Compute Engine
To better understand the Monitoring feature, let's look at how monitor the Apache Web Server installed on a Compute Engine virtual machine (VM) instance
We will follow these steps:
- Create a Compute Engine VM instance.
- Install an Apache Web Server.
- Install and configure Ops Agent for Apache Web Server.
- Generate traffic and view metrics on a predefined Apache dashboard.
- Create an alert policy
- Clean up.
Step 1: Create a Compute Engine VM instance
In the Google Cloud console, go to Compute and select Google Compute Engine:
- Go to Compute Engine section
- To create a VM instance, click Create instance.
- Fill in the instance fields as follows:
- In Field Name, enter quickstart-vm.
- Field Machine type, select Small.
- Make sure that the Boost disk section is configured for Debian GNU/Linux.
- Field Firewall, select both options Allow HTTP traffic and Allow HTTPS traffic.
- The remaining fields are set to default values.
- Click Create. When your VM is ready, it will appear in the list of Instances in the Instance Tab
Step 2: Install an Apache Web Server
To deploy an Apache Web Server on a Compute Engine VM instance, you need to do the following:
- To open the terminal for your Instance, in column Connect, choose SSH
- To update the list of packages on your Instance, run the following command: sudo apt-get update
- To install Apache2 HTTP Server, run the following command: sudo apt-get install apache2 php7.0
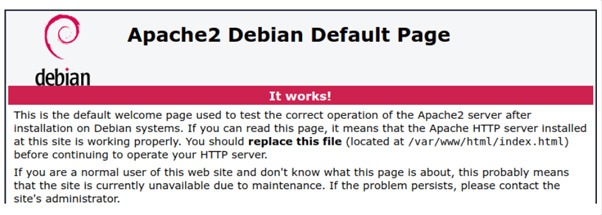
- Open your browser and connect to the Apache2 HTTP server using the URL http://EXTERNAL_IP, where EXTERNAL_IP is your virtual machine's External IP address. You can find this address in the External IP column of the VM instance
Apache2's default page is as follows:
Step 3: Install and configure Op Agent for Apache Web Server
To collect logs and metrics from the Apache Web Server, install Ops Agent using the terminal:
- To open a terminal for the VM instance, in column Connect, click SSH.
- To install Ops Agent, run the following command:
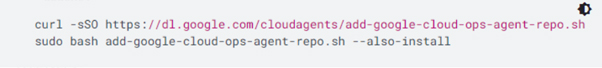
You will see google-cloud-ops-agent installation succeeded.
- Copy the following command line, and paste it into the terminal:
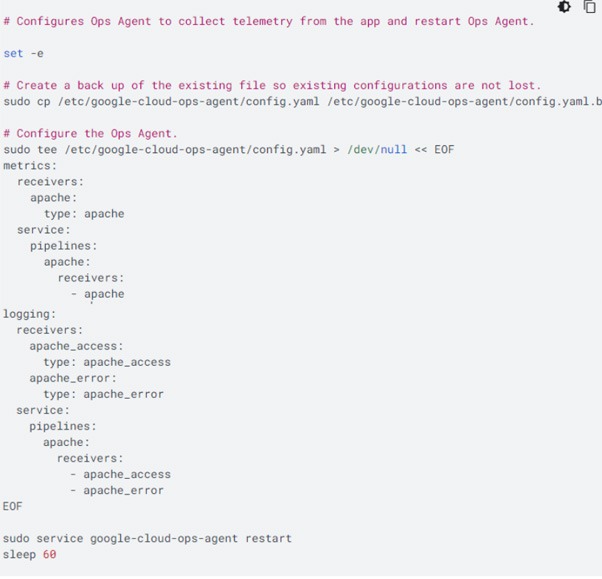 This command will create configuration to collect and import logs and metrics from the Apache Web Server. For more information about importing logs from Apache Web Server, see Configure Opt Agents for Apache Web Server.
Step 4: Generate traffic and view metrics on the Apache dashboard:
Monitoring dashboards allow you to view and analyze metrics related to your services. In this initialization section, you create metrics on the Apache Web Server and view the data on the automatically generated Apache GCE Overview dashboard.
To create metrics on your Apache Web Server, do the following:
- In the Google Cloud Console, go to Compute Engine
- In the Connect column, select SSH to open a terminal for the VM instance.
- To generate traffic on the Apache Web Server, run the following command:
 The previous command generates traffic by sending requests to the Apache Web Server every 4 seconds.
To view the Apache GCE Overview console, do the following:
- In the Google Cloud Console, select Monitoring
- In the link bar, select Dashboard.
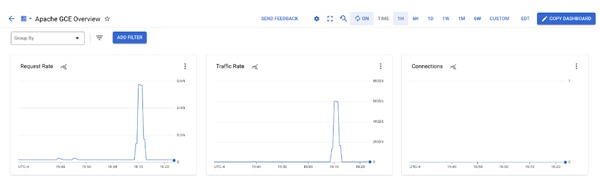
- In all Dashboards, select Apache GCE Overview dashboard. Dashboard opens.
In the Dashboard, there are several charts containing Apache and Compute Engine integration information:
Step 5: Create an alert policy
To create an alert policy to monitor data and send email notifications when the traffic rate on your Apache Web Server exceeds 4 KiB/s, do the following:
- In the Google Cloud console, select Monitoring
- In the navigation bar, select notifications Alerting and click Create policy.
- Select the time series to be monitored: Select the time series to be monitored:
- Click Select a metric and enter VM instance in the filter bar
- In the list Active metrics, select Apache.
- In the list Active metrics, select workload/apache.traffic.
A graph of Apache Traffic data will be displayed
- In section Transform data section, choose the following values:
- Rolling window: 1 min
- Rolling window function: rate
- In the section Configure alert trigger, select the following values and click Next:
- Alert trigger: Any time series violations
- Threshold position: Above threshold
- Threshold value: 4000
- In the Configure notifications and finalize alert section, select the following values:
- Notification channels: The email you want to receive alerts to.
- Incident autoclose duration: 30 min
- Name the alert policy: Apache traffic above threshold
- Click Create policy. Your alert policy will now be enabled.
Test the alerting policy
To test the alerting policy you just created, do the following:
- In the Google Cloud console, go to Compute and select Compute Engine:
- In the Connect column, click SSH to open a terminal to your VM instance
- In the terminal, enter the following command line:
This command will generate traffic in your Apache Web Server.
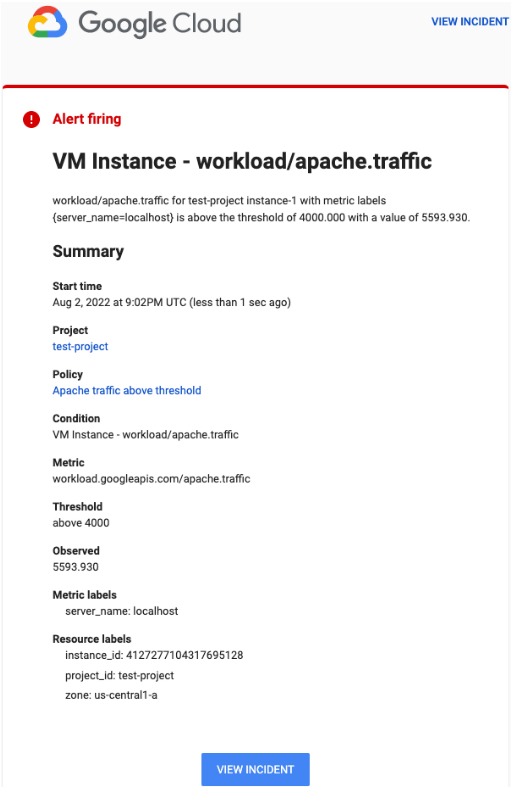
Once the traffic threshold value exceeds 4 KiB/s in your Apache Web Server, a notification will be sent via email. It may take a few minutes to complete this process.
The email notification you receive resembles the following:
Step 6: Clean up
To avoid incurring charges to your Google Cloud account for resources used on this page, follow these steps.
If you created a new Google Cloud project, delete the Google Cloud project:
- In Google Cloud console, go to page Manage resources.
- In the project list, select the project you want to delete and click Delete.
- In the dialog, type project ID, and click Shut down to delete the project
If you create a new VM in an existing project, then delete the VM instances: If you created a new VM in an existing project, then delete this VM instance:
In the Google Cloud console, go to the VM instances page.
- Select the checkbox for the instance you want to delete
- To delete the instance, click More actions, click Delete, and follow these instructions.
If you are already using an existing VM Instance for quick startup, uninstall Ops Agents:
To uninstall Ops Agent, open terminal and run the following command:
 Above are detailed instructions on how to use your system data monitoring management settings with the feature Cloud Monitoring (Stackdriver Monitoring) for compute engine, hope this information will be useful to you.
If you need advice on Google Cloud technical solutions, please contact Gimasys – Google Cloud Premier Partner with the following information:
- Email: gcp@gimasys.com
- Hotline: 0974 417 099
Related Posts