Trong quá trình vận hành, các chuỗi hoạt động như họp trực tuyến, đào tạo…
Data analysis, feature selection for better ML models
Khi bạn bắt đầu với một dự án máy học (ML), một nguyên tắc quan trọng cần ghi nhớ là dữ liệu là tất cả. Người ta thường nói rằng nếu ML là động cơ tên lửa, thì nhiên liệu là dữ liệu (chất lượng cao) được cung cấp cho thuật toán ML. Tuy nhiên, tìm ra sự thật và cái nhìn sâu sắc từ một đống dữ liệu có thể là một công việc phức tạp và dễ bị lỗi. Để có một khởi đầu vững chắc cho dự án ML của bạn, việc phân tích dữ liệu trước là hết sức quan trọng, một trong các bước là mô tả dữ liệu bằng các kỹ thuật thống kê và trực quan hóa để đưa các khía cạnh quan trọng của dữ liệu đó vào trọng tâm để phân tích thêm. Trong quá trình đó, điều quan trọng là bạn phải hiểu thật kĩ về:
- Data properties: such as schema and statistical properties;
- Quality of data: like missing values and inconsistent data types;
- The predictive power of data: such as the relationship of features to the target.
This process is the foundation for subsequent engineering and feature selection steps, and it provides a solid foundation for building better ML models.
There are many different approaches to conducting exploratory data analysis (EDA) out there, so it can be difficult to know which analysis to do and how to do it right. To reinforce recommendations for conducting EDA, data cleaning, and appropriate feature selection in ML projects, Google summarizes and provides brief guidance from both visual (visual) perspectives. ) and strict (statistical). Based on the results of the analysis, you can then define feature selections and corresponding technical recommendations. You can also see more tutorials by this link.
You can also check Automatic data discovery and feature recommendation engine that Google has developed to help you automate recommended analysis, regardless of the size of your data, and then generate well-organized reports that present the results.
EDA, feature selection, and feature engineering are often tied together and are important steps in the ML journey. Given the complexity of data and the business issues that exist today (such as credit scoring in finance and demand forecasting in retail), how the results of an appropriate EDA can affect Your next decision is a big question. In this post, Google will walk you through some of the decisions you'll make about your data for a particular project, and choose what type of analytics to use, along with visualizations, tools, and processing. feature management.
Let's start exploring the types of analytics you can choose from.
Statistical data analysis
With this type of analysis, data exploration can be conducted from three different perspectives: descriptive, correlated, and contextual. Each type introduces additional information about the properties and predictability of the data, helping you make informed decisions based on the results of your analysis.
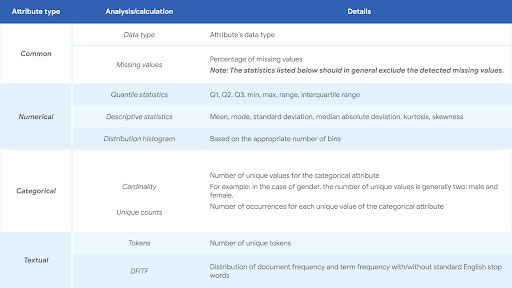
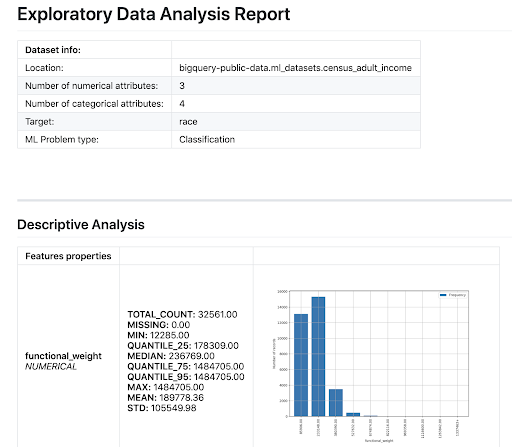
1. Descriptive analysis (Univariate analysis)
Descriptive analysis, or univariate analysis, provides an understanding of the characteristics of each attribute of a dataset. It also provides important evidence for preprocessing and selection at a later stage. The following table lists the recommended analysis for common, numerical, categorical, and text attributes.
2. Correlation analysis (bivariate analysis)
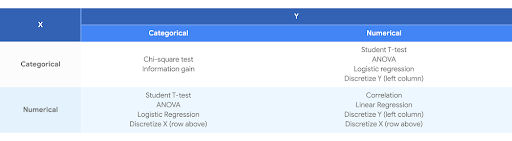
Correlation analysis (or bivariate analysis) tests the relationship between two properties, say X and Y, and checks whether X and Y are correlated. This analysis can be done from two perspectives to get different possible combinations:
- Qualitative analysis. This performs the calculation of the descriptive statistics of the dependent categorical/numeric attributes according to each unique value of the independent categorical attribute. This perspective helps to intuitively understand the relationship between X and Y. Visualization is often used in conjunction with qualitative analysis as a more intuitive way to present results.
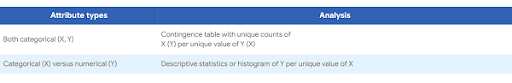
- Quantitative analysis. This is a quantitative test of the relationship between X and Y, based on a hypothesis testing framework. This perspective provides a formal and mathematical method for quantitatively determining the existence and/or strength of a relationship.
3. Context analysis
Descriptive analysis and correlation analysis are both general enough to be performed on any structured data set, neither of which requires context information. To further understand or profile a given dataset, and to understand more about specific domains, you can use one of two common contextual information-based analytics:
- Time-based analysis:In many real-world datasets, a timestamp (or similar time-related attribute) is one of the key pieces of contextual information. Observing and/or understanding the characteristics of data over time, with varying levels of detail, is essential to understanding the data generation process and ensuring data quality
- Agent-based analysis: As an alternative to time, another common attribute is the unique identifier (ID, such as user ID) of each record. Analyzing the dataset by aggregating along agent size, i.e., histogram of the number of records per agent, can further improve your understanding of the dataset.
Example of time analysis:
The figure below shows the average number of trains per hour that originate and end at a specific location based on a simulated dataset
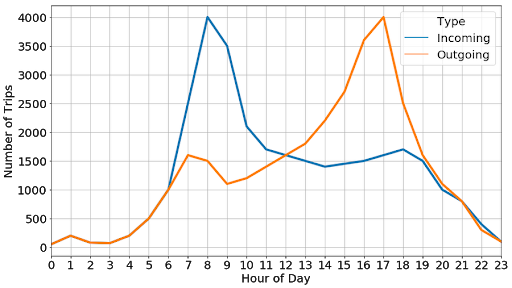
From this, we can conclude that peak times are between 8:30 a.m. and 5:30 p.m., which is consistent with the intuition that these are the times when people usually leave home in the morning and return to their homes. back after a working day.
Selection of features and techniques
The ultimate goal of EDA (whether rigorously or through visualization) is to provide insights into the dataset you're studying. This can inspire your next feature selection, technique, and modeling process.
Descriptive analysis provides basic statistics of each attribute of the dataset. Those statistics can help you identify the following problems:
- High percentage is missing
- Low variance
- Low entropy of categorical properties
- Classification target imbalance (class imbalance)
- Oblique distribution of numeric attributes
- High Cardinality of Categorical Attributes
Correlation analysis examines the relationship between two attributes. There are two typical action points triggered by correlation analysis in the context of feature selection or feature engineering:
- Low correlation between features and goals
- High correlation between features
After you have identified the problems, the next task is to make a sound decision on how to properly mitigate these problems. One such example is for the high percentage of missing values. The problem was identified as a missing attribute in a significant proportion of the data points. The threshold or definition of importance can be set based on domain knowledge. There are two options for handling this, depending on the business scenario:
- Assigning a unique value to the missing value records, if the missing value, in certain contexts, actually makes sense. For example, a missing value may indicate that a monitored underlying process is not functioning properly.
- Discard the feature if values are missing due to misconfiguration, data collection problems or uncontrollable random reasons, and historical data can be restored.
You can check the whitepaper To learn more about ways to solve the above problems, it is recommended to visualize each analysis and examine the most appropriate tools available.
Some tools to help you automate
To further help you speed up data preparation for machine learning, you can use Automatic data discovery and feature recommendation engine by Google to automate recommended analysis regardless of the size of the data and generate well-organized reports presenting results and recommendations.
Automation EDA tools include:
- Descriptive analysis of each attribute in a dataset for numerical, categorical;
- Correlation analysis of two attributes (number versus number, number vs class, and class vs class) through qualitative and/or quantitative analysis.
Based on the EDA performed, the tool makes feature recommendations and generates a summary report, which looks something like this:
Source: Gimasys
Related Posts