Nhờ công nghệ lõi "Agentic AI" (AI tự chủ), Trí tuệ nhân tạo đang tiến…
Log analysis made easier with Log field analytic
Google knows that programmers or operational technicians who troubleshoot applications and systems have a lot of data to sort through while finding the root cause of problems. Usually, having fields like error codes is important for finding answers and solving those problems. Today, Google announced log analysis in Cloud Logging, a new way to search, filter, and understand the structure of your logs so you can find answers faster and easier than ever.
System log analysis
Last year, Google Cloud launched Logs Explorer to help find and analyze your system logs faster, with features like Log fields pane and histogram, as well as saved and shared queries. In Logs Explorer, the Log fields pane and histogram both provide useful information to help analyze your logs.
With the Log fields pane, each resource type, maps to a specific Google Cloud service like BigQuery or Google Kubernetes Engine (GKE), consisting of a set of fields and default values found in the log loaded into Logs Explorer. The log field includes the name of the log field, a list of values, and the total number of logs that fall within that category. Let's look at these terms more precisely:
- Log fields – These are specific fields in your log. All logs in Cloud Logging use message format LogEntry. For example, the logName field is present in all logs in Cloud Logging. When you log it, it also includes textPayload, jsonPayload or protoPayload fields such as jsonPayload.http_req_status.
- Log field value – The value of a specific log field. For example, for a log entry with a jsonPayload.http_req_status field, some sample values could be “200”, “404”, or “500”.
You can now get a complete list of values for the selected log fields and count the number of logs that match the value using log field analysis. You can analyze the application or system logs using the fields in jsonPayload or protoPayloads of the log entries and then easily refine your query by selecting the field values to see the details of the log entries. appropriate log.
Better troubleshooting by analyzing log values
Log field analysis makes it easy to quickly detect unexpected values. By adding a field to the Log fields pane, you can see all the values that appear in the log and then select any value to filter the log by those values.
In this sample e-commerce app, Google added the jsonPayload.http_req_path field and can now view the request paths over time. In the screenshot below, it is easy to see that there are some unexpected values that indicate a problem, such as “/products/error” and “products/incorrectproduct”. Next to those values is the total number of matching log entries. These values can help you narrow down the cause of the error and find an easy fix.
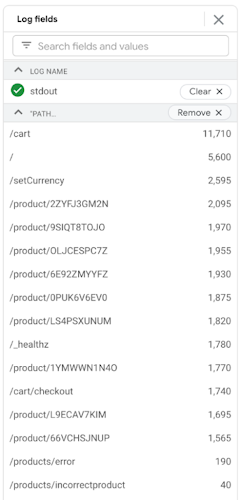
The Aggregated Logs field shows the number of entries for each http_req_path log value (messages /products/errors and /products/incorrect products)
Filter using the value . fields
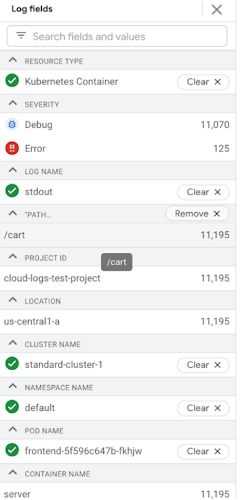
The field value selection in the Log fields pane can be used to refine your query so that you can only view logs that contain the selected value. In the Google example above using the jsonPayload.http_req_path field, it is possible to select a specific value, “/cart” in this case, and see the log broken down by severity.
Get a better understanding of your audit logs
Using log field analysis, you can easily find values in audit logs for services Google Cloud Platform. For example, you might want to identify accounts that are requesting data access for a particular GKE cluster. If you add the protoPayload.authenticationInfo.principal Email field as a custom field to the Log fields pane, you'll get both a list of the accounts that made the request and the number of log entries for each account value.
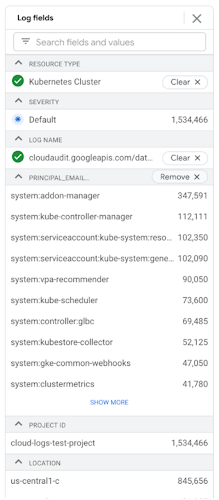
Log fields show the number of log entries for each principalEmail value
Starting from today
Log field analysis, and Histogram are features that Google recently added to Logs Explorer and they are ready for you to use today. But don't stop there! Please join discussion forum of Google Cloud for more information on what's coming next and to provide feedback on your experience using Cloud Logging.
Source: Gimasys
Related Posts