Google AppSheet là chiếc chìa khóa giúp doanh nghiệp tiến nhanh hơn trên con đường…
Embed charts from Google Sheets into Google Docs and Slides
In the process of working, users often use charts as a tool to display data to be analyzed, making work more efficient and analytical content more intuitive.
Previously, when a chart changed, users would have to go back to Google Sheets – the file containing the original chart, and then copy it back to Google Docs or Slides. Now, with this new update feature, users only need to update the chart right on the Google Docs or Slides interface with just one click.
1. Steps to take
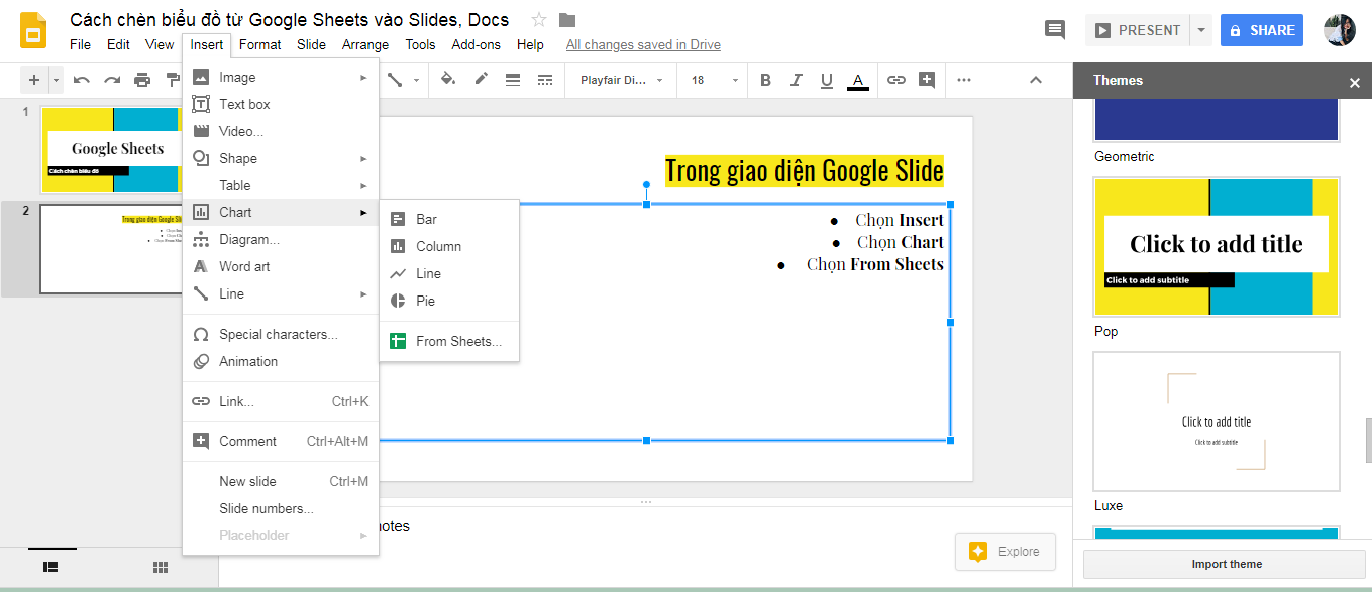
- On the Google Docs or Slides website interface, to insert a chart into the document, click Insert > Chart or choose From Sheets to insert an existing chart from a previous Google Sheets file.
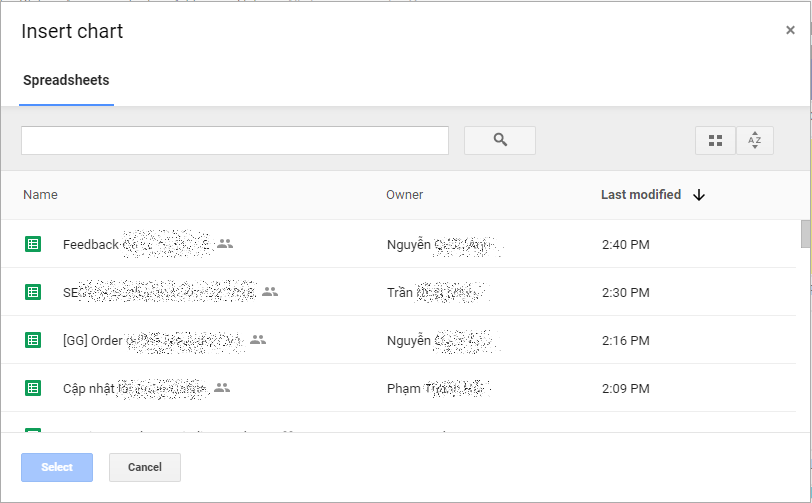
- Then you choose a sheet file containing the data and charts that you want to insert into Google Slides
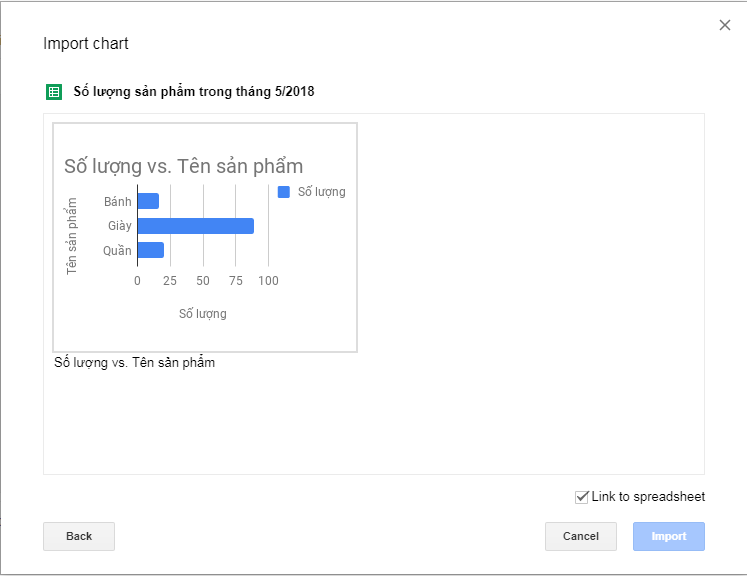
- If there are many charts in the Sheets file, select the chart you want to select.
- To change the inserted chart in Google Slides, you change the data on Google Sheets: When clicking to select the cell Link to spreadsheet, Any changes you make in Google Sheets will be updated in Google Slides or Google Docs.
That way, you won't have to go to Sheets, change data and charts, and then go back to Slides to update the new chart. All troubles are solved with just one click.
Attention: Apart from the file owner, this feature of inserting and updating charts will only be available to 'collaborators' - authorized collaborators to edit the document.
2. Tips and tutorials related to Google Sheets
- Cách sử dụng Google Sheets để có được insight (Phân tích dữ liệu chuyên sâu): Thanks to advances in Cloud technology and artificial intelligence, you can handle data a lot better. Even if you're not a master of numbers, you can even spell out the question: "How much revenue does each product make?" and Google Sheets will give you the most suitable chart for you.
- Instructions to restrict access in Google Sheets: Teach you how to assign access rights, restrict editing rights to each cell/column/region in Google Sheets.
- How to create header and footer in Google Sheets: Create a more professional sheet file with Google sheets' own header and footer.
- Create a more professional presentation Slide with improvements in Google Slides: New G Suite integrations, apps from Google partners, and customization options.
- Google changed the toolbar menu in Google Docs, Slides: Google has made changes to the menu (category) and toolbar (toolbar) in Google Docs and Slides on the Web.
Updated: Gimasys
Related Posts